Ever look at a stock chart and think… “OK, now what?”
Me too…
We are thrilled to announce a revolutionary upgrade to our Pattern Finder product driven by generative-AI that answers that very question: Now what?
This is a 1 minute video demonstration, and at second 0:27, the revolution appears.
What’s New: Generative-AI in a Live Chart
With this upgraded capability, you’ll have access to cutting-edge AI that can answer your most pressing questions about stock charts with precision.
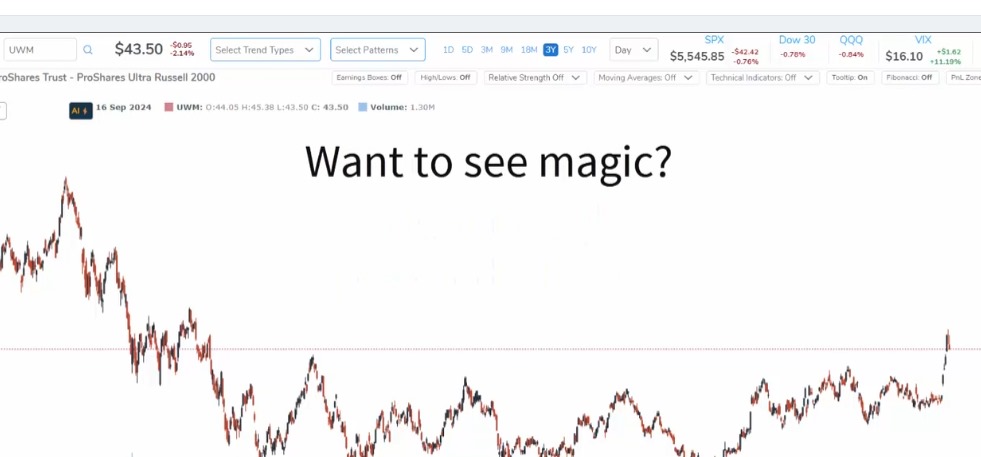
In the “old days,” as in up until today, you got this chart with our algorithms and were left with… “Now what?”

Now, here’s a glimpse of what our generative AI can do: Note AIChart-GPT on top of the chart when requested.

First, get a bearish or bullish rating (on a scale from 0-100), taking into account volume, trends, and more.

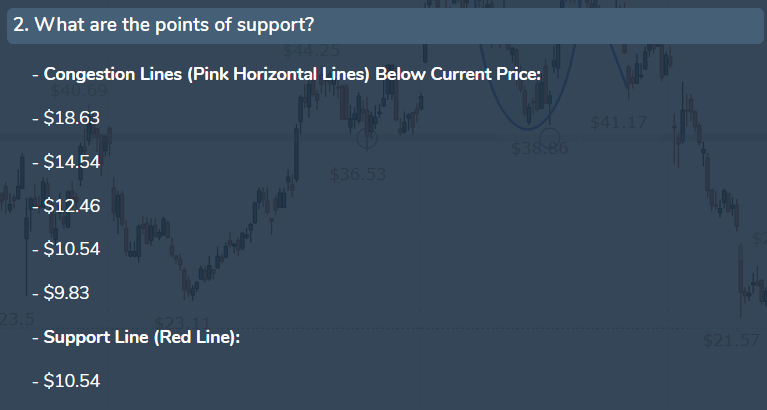
Next, it will determine the points of support.

Then the points of resistance.

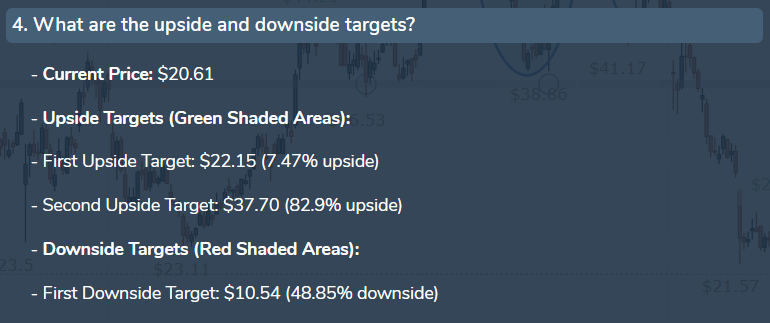
From there, it will determine the upside and downside targets based on the points of support and resistance.

Finally, it provides a summarized trading plan based on all of the details provided.

We are confident that this powerful feature will significantly enhance your trading strategy and help you make more informed decisions.
Try this right in Pattern Finder for $28/mo or just $298/yr right here:
Save on Pattern Finder Today
Legal
The information contained here is provided for general informational purposes, as a convenience to the readers. The materials are not a substitute for obtaining professional advice from a qualified person, firm or corporation. Consult the appropriate professional advisor for more complete and current information. Capital Market Laboratories (“The Company”) does not engage in rendering any legal or professional services by placing these general informational materials on this website.
The Company specifically disclaims any liability, whether based in contract, tort, strict liability or otherwise, for any direct, indirect, incidental, consequential, or special damages arising out of or in any way connected with access to or use of the site, even if I have been advised of the possibility of such damages, including liability in connection with mistakes or omissions in, or delays in transmission of, information to or from the user, interruptions in telecommunications connections to the site or viruses.
The Company makes no representations or warranties about the accuracy or completeness of the information contained here. Any links provided to other server sites are offered as a matter of convenience and in no way are meant to imply that The Company endorses, sponsors, promotes or is affiliated with the owners of or participants in those sites, or endorse any information contained on those sites, unless expressly stated.
