Lede
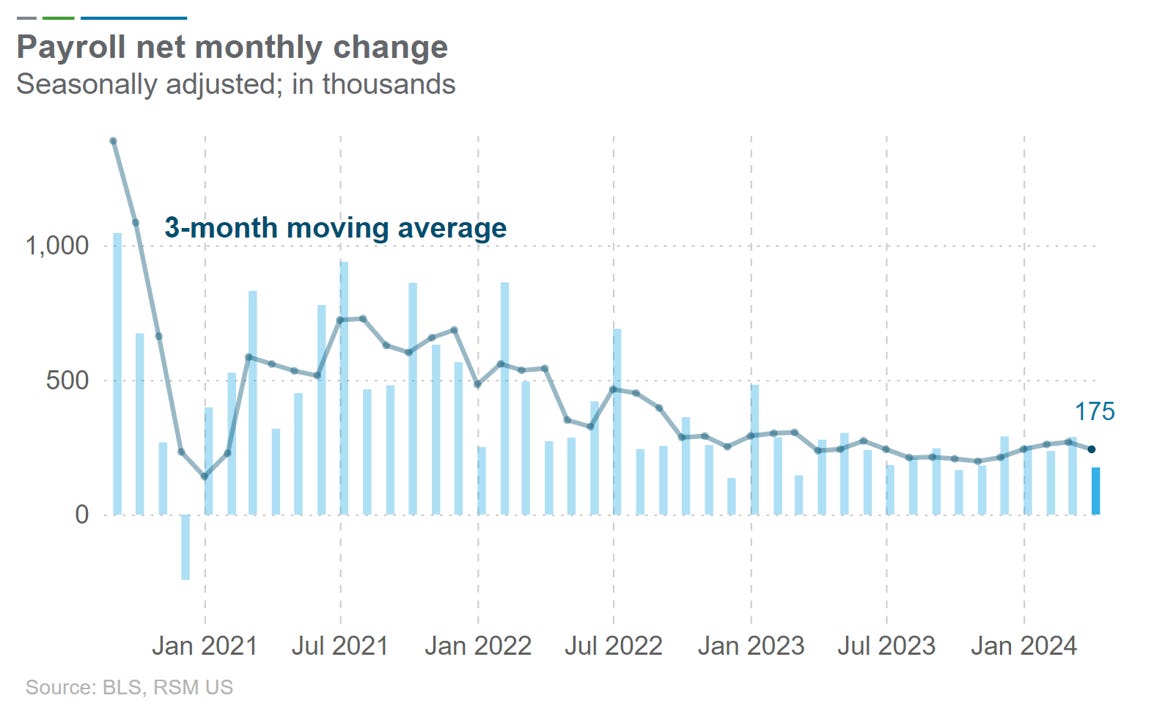
The non-farm payroll (NFP) report today was pretty close to ideal – a respectable addition of 175,000 jobs and a robust monthly average of around 250,000 jobs, especially noteworthy following strong prior months.
Meanwhile, the unemployment rate slightly increased to 3.9% but has now tied the longest streak ever of unemployment below 4% (1960s) in the United States.
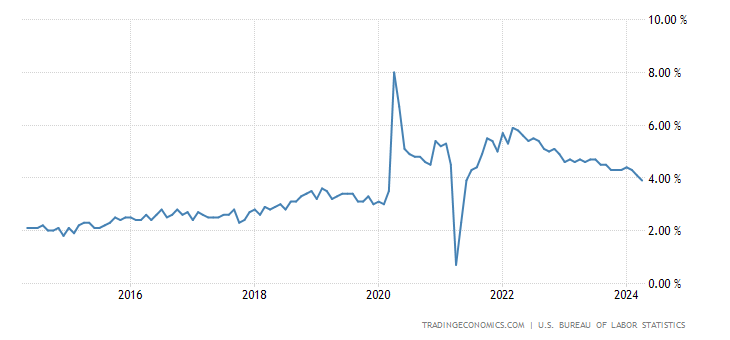
Wage growth has decelerated.
This NFP report offers the most reassuring data for the Federal Reserve in over two weeks.
Preface
Today we received the much anticipated non farm payrolls (NFP) report ( “the jobs report) and with it data not just on jobs, but also the unemployment rate, wage inflation, and labor participation.
- US Non Farm Payrolls:
- 175K vs 243K consensus and 315K prior.
- US Average Hourly Earnings YoY:
- 3.9% vs 4% consensus and 4.1% prior.
- US Average Hourly Earnings MoM:
- 0.2% vs 0.3% consensus and 0.3% prior.
- US Average Weekly Hours:
- 34.3 vs 34.4 consensus and 34.4 prior.
- US Unemployment Rate:
- 3.9% vs 3.8% consensus and 3.8% prior.
- US Labor Force Participation Rate:
- 62.7% vs 62.7% consensus and 62.7% prior.
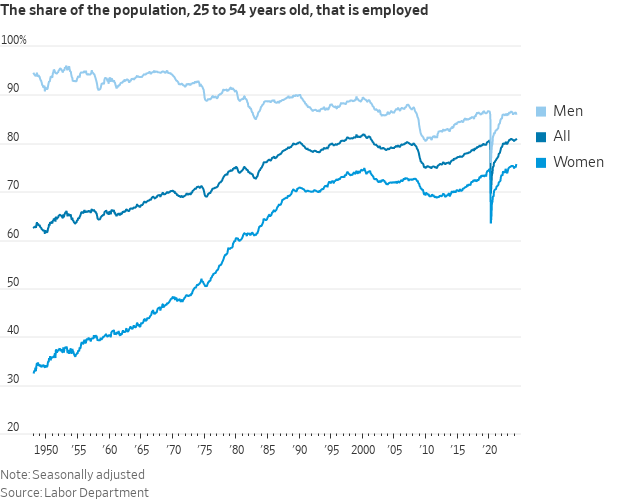
- Prime Aged Women Labor Force Participation Rate at all-time high.
We further received data on the Services industry in the ISM Purchasing Managers Index (PMI) which we touch on briefly at the conclusion.
The NFP report showed 175K new jobs were added in April, below consensus estimates of 243K and last month’s 315K.
While stagflation become the term du jour, it’s just not happening – not yet, at least.
We have 159 million people employed, robust yet moderating wage growth—consistently outpacing inflation for 14 straight months—unemployment under 4% for the 27th consecutive month, and real final private demand growing at a 3.1% rate.
Here is a chart from Joseph Brusuelas of non farm payrolls (jobs added) looking at the three-month rolling average:
Full-time employment rose by 950,000, while part-time employment for economic reasons held steady at 4.5 million among 159 million working individuals.
Most part-time work is voluntary, indicating that recent concerns about part-time employment are unfounded and do not accurately represent the fundamentally strong American labor market.
In April, 75.5% of U.S. women aged 25 to 54 were employed, marking a record high. Additionally, the employment-population ratio for prime-age workers reached 80.8%, nearing its highest level since 2001.
Here is a chart from Nick Timiraos, Chief economics correspondent, The Wall Street Journal:
Even the disabled employment rate is back to the all-time high of 23%.
Today’s unemployment rate (3.9%) below 4% matches the record for the longest consecutive monthly streak ever in the United States, previously set in the late 1960s.
In April, the three-month annualized growth rate for nominal average hourly earnings dropped to 2.8%, significantly lower than the rate in March and the smallest increase since March 2021.
Here is a chart of wage inflation YoY:
US Average Hourly Earnings YoY 10-Year chart (Source)
In total, the market likes the report.
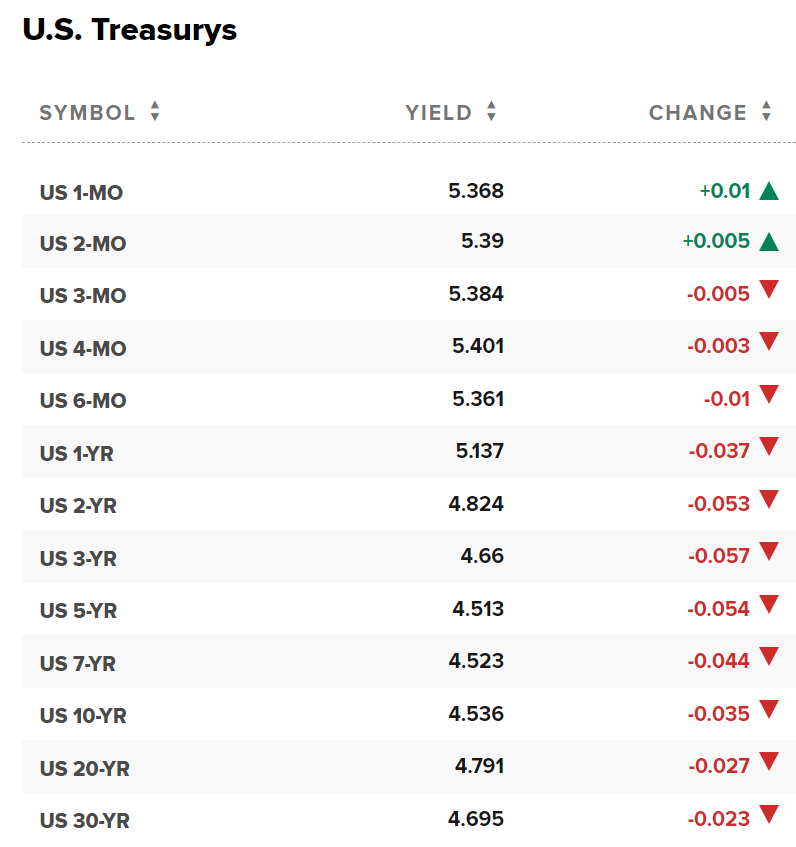
Almost instantly, yields ticked down:
The probability of a rate cut on the September FOMC meeting has risen to 93%.
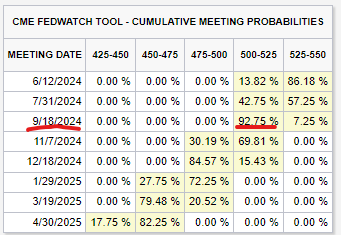
The probability of a rate cut in the July meeting has risen to 43%.
—
We will not cover PMI data today thoroughly but do highlight one thing:
The April ISM Services PMI fell into contraction territory with a reading of 49.4, compared to an expected 52.0 and the previous month’s 51.4. New orders remained in growth at 52.2, while the prices paid increased to 59.2. However, the employment index declined to 45.9.
Data Lede
- US Non Farm Payrolls:
- 175K vs 243K consensus and 315K prior.
- US Average Hourly Earnings YoY:
- 3.9% vs 4% consensus and 4.1% prior.
- US Average Hourly Earnings MoM:
- 0.2% vs 0.3% consensus and 0.3% prior.
- US Average Weekly Hours:
- 34.3 vs 34.4 consensus and 34.4 prior.
- US Unemployment Rate:
- 3.9% vs 3.8% consensus and 3.8% prior.
- US Labor Force Participation Rate:
- 62.7% vs 62.7% consensus and 62.7% prior.
- S&P Global US Services PMI:
- 51.3 vs 50.9 consensus and 51.7 prior.
- S&P Global US Composite PMI:
- 51.3 vs 50.9 consensus and 52.1 prior.
- US ISM Non-Manufacturing New Orders:
- 52.2 vs 54.5 consensus and 54.4 prior.
- US ISM Non-Manufacturing Prices:
- 59.2 vs 55.0 consensus and 53.4 prior.
- US ISM Non Manufacturing Business Activity:
- 50.9 and 57.4 prior.
- US Non Manufacturing PMI:
- 49.4 vs 52.0 consensus and 51.4 prior.
- US ISM Non Manufacturing Employment:
- 45.9 vs 49.0 consensus and 48.5 prior.
Conclusion
What the Fed thinks about inflation and the underlying economic data is the only thing that matters. The economy is strong, for now.
So, let’s just wait and let the Fed lead us, for better or worse.
This is not the time for children and amateurs – this is not the time for catastrophizing. This is the time for patience and thoughtfulness.
Consider your long-term goals and your current perspective and, perhaps, consider what i means if they are in disagreement.
Take care of yourselves and your loved ones. The irritant was COVID and the further we get from the irritant the less irritated we will be.
If you’re an investor with room in your portfolio for tech stocks, check out CML Pro – our research service.
While we have over 600 institutional readers from firms like Goldman Sachs, Morgan Stanley, JP Morgan, and the rest, we do offer retail investors a 90% discount.

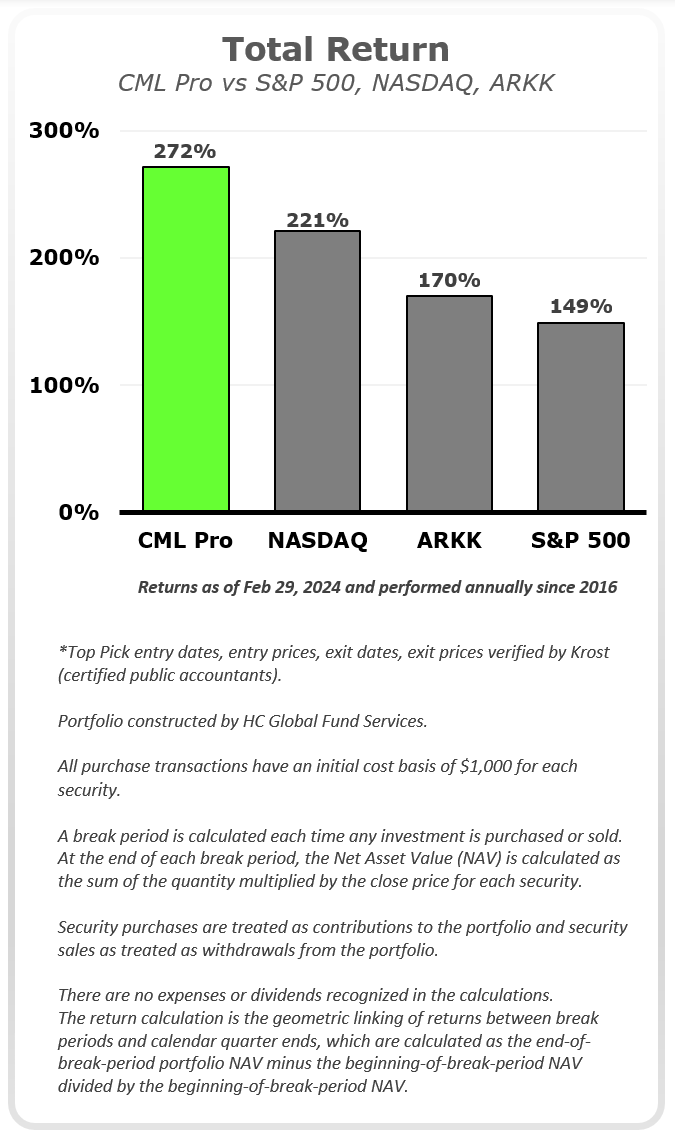
Our performance has been and is continuously double verified by an audit firm and a fund services firm. Here is a chart of the returns since we started (Jan 1, 2016):
Here is a 4-minute video:
This is your last chance to save on CML Pro.
CML Pro will be $800/yr. soon. You can join now for just $39/mo. and never see a price increase.
Learn about “After This Winners” exclusive to CML Pro.
Thanks for reading, friends.
Legal
The information contained on this site is provided for general informational purposes, as a convenience to the readers. The materials are not a substitute for obtaining professional advice from a qualified person, firm or corporation. Consult the appropriate professional advisor for more complete and current information. Capital Market Laboratories (“The Company”) does not engage in rendering any legal or professional services by placing these general informational materials on this website.
The Company specifically disclaims any liability, whether based in contract, tort, strict liability or otherwise, for any direct, indirect, incidental, consequential, or special damages arising out of or in any way connected with access to or use of the site, even if I have been advised of the possibility of such damages, including liability in connection with mistakes or omissions in, or delays in transmission of, information to or from the user, interruptions in telecommunications connections to the site or viruses.
The Company makes no representations or warranties about the accuracy or completeness of the information contained on this website. Any links provided to other server sites are offered as a matter of convenience and in no way are meant to imply that The Company endorses, sponsors, promotes or is affiliated with the owners of or participants in those sites, or endorse any information contained on those sites, unless expressly stated.
