Lede
Today we extend our analysis from the prior post, and look at various option trades in the S&P 500 and the Russell 2000.
This is a reminder that while there is plenty of room for stock specific backtests, pre-earnings, post-earnings, ignoring earnings, and everything in between, there are also opportunities to examine in the indices.
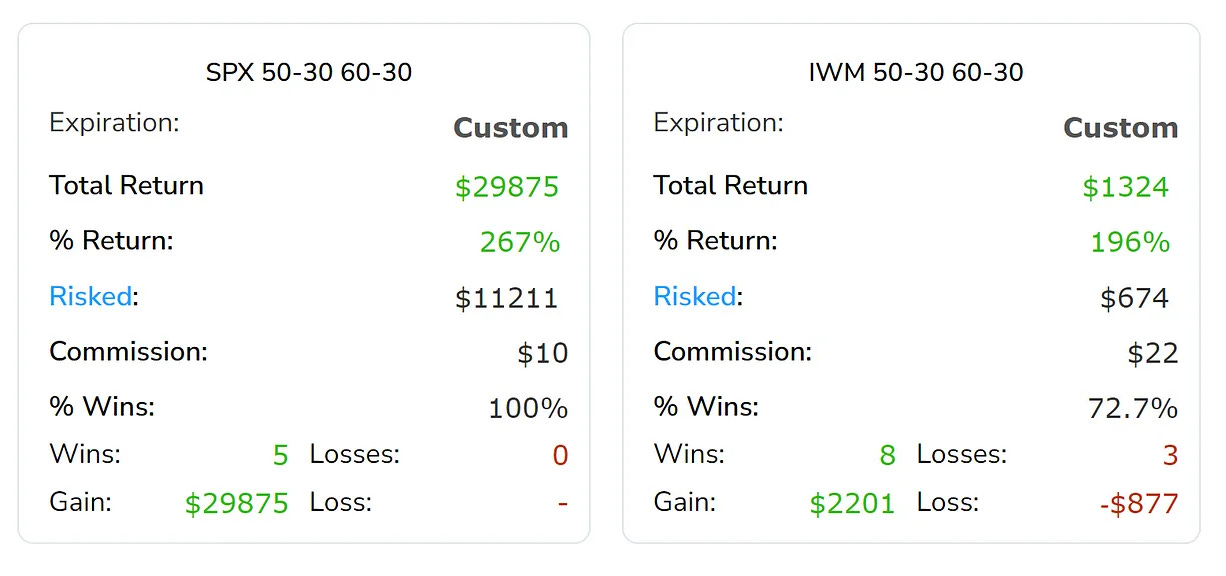
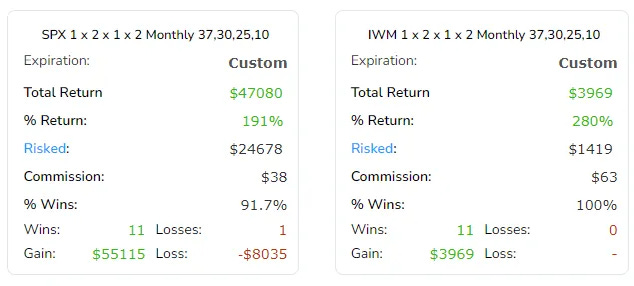
Here is a sneak peak at the three-year backtests of the different trades we present:
Set-up #1: Conditions, Backtests, and Alerts
We continue our analysis from prior with a look at large drops in the indices, specifically what would qualify as a “correction;” that’s a price drop of at least 10%.
In this case we look to a trigger of a 10% drop within the last 60-days.
We set it up in TradeMachine in three seconds with this:

We tested getting bullish during the next month, but since the indices would be down 10% in the last 60-days when this triggers, we also want to take advantage of likely higher implied vol in the shorter-dated options.
So, we tested the results of getting long an at the money call option (50-delta) that expires in 60-days and simultaneously getting short an out of the money call option (30-delta) that expires in 30-days.
That’s selling the elevated near-term vol and owning the longer dated vol, with a 50 to 30 delta difference; which is the bullish portion of the trade.
Here is the strategy in TradeMachine.

Finally, since this trade triggers when the market has been in a down trend, we will set stops and limits:

So, this trade triggers with a 10% or greater drop in the last 60-days in the indices, and closes either when the short-dated option expires, or if a 50% stop or 50% limit is hit, whichever of these happens first.
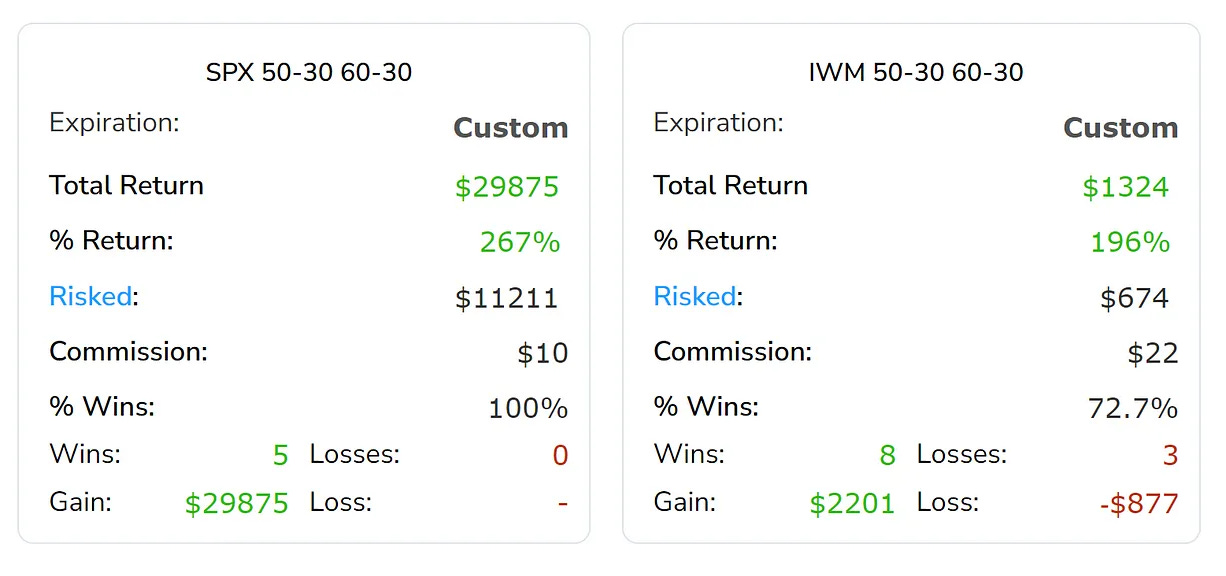
Here are the results over the last three- and one-year in the S&P 500 (through SPX) and the Russell 2000 (through IWM):
3-years
1-year
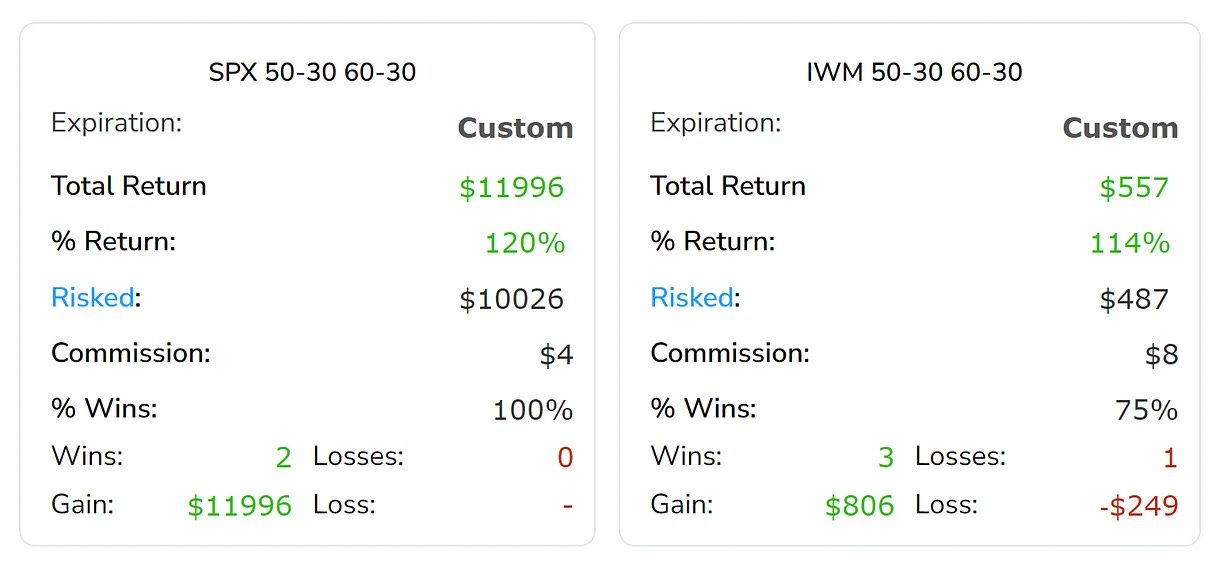
Not too shabby.
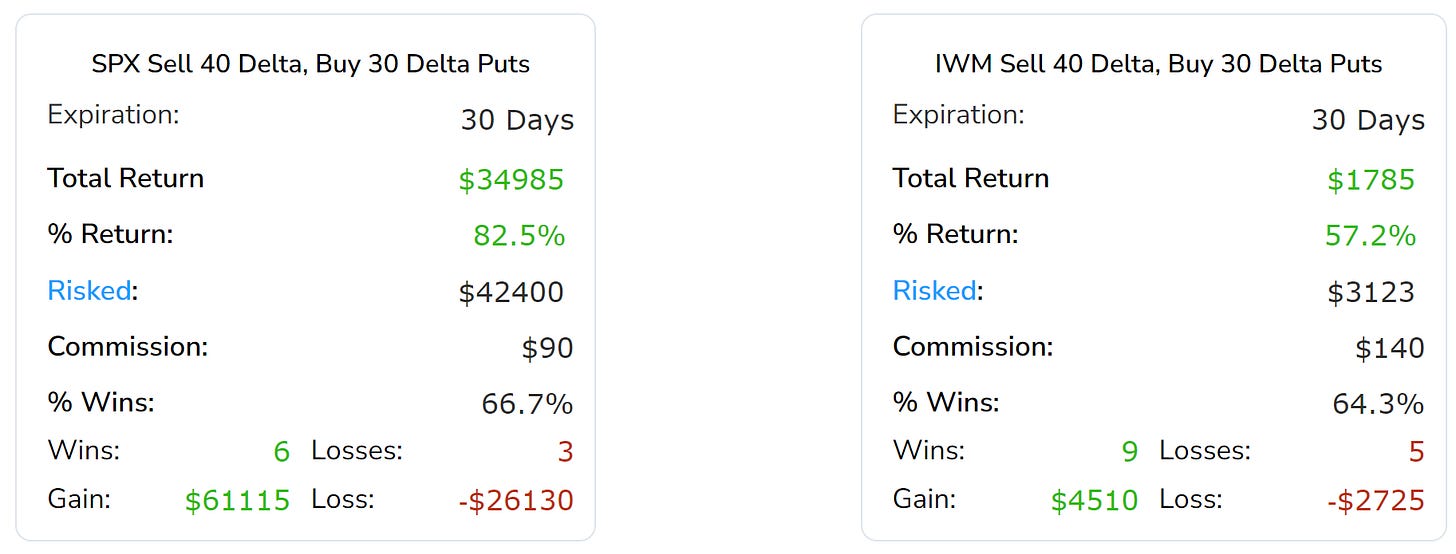
We then looked at the same trigger, but instead of looking at a long call calendar spread, we examined a short out of the money (40 delta / 30 delta) put spread with 30-day options.
Here are the results over thee- and one-years:
Three-Years
One-Year
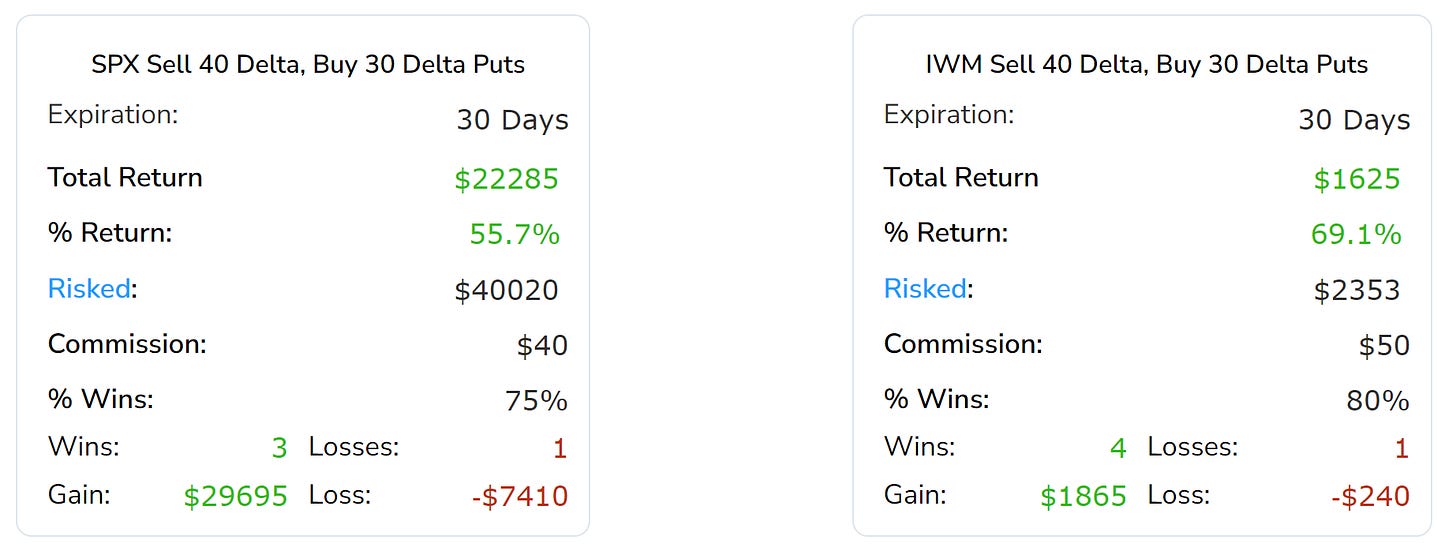
Again, we see strong results over both time frames.
Next we look at backtests when the indices are not up or down a lot on the last 60-days.
Set-up #2: Conditions, Backtests, and Alerts
Next we look at a four-legged option strategy backtest, which has a rolling trigger as long as the index is below the 50-day simple moving average but above the 200-day moving average.
This, by construct, also implies that the 50-day SMA is greater than the 200-day SMA. if that’s not immediately obvious to you, we can simply add that condition (though it is redundant) to the technical open as well.
So, here it is:

The strategy we tested is called “1-by-2 by 1-by-2.”
It looks like this:

Don’t let your eyes rollback and ignore this.
These are the results we’re after:

Option trading is difficult and leaving analysis undone simply because “it seems hard,” is not being a trader – it’s being lazy.
After you read the analysis, then certainly, any trader can decide not to engage in such a strategy, but understand it first.
We spend a lot of time researching individual stocks, but let us never forget that option trading is volatility trading, whether we mean it to be or not. In fact, we have a seminal webinar that covers this reality and dates back to the Great Recession for back-test results.
Now, let’s review each leg.
Rules (Example)
The first leg of this trade is simply a long, out of the money (37 delta) put. That’s it.
* Buy a 37 delta monthly put.

The second leg of this trade sells two further out of the money (30 delta) puts.
* Sell two 30 delta monthly puts.

The third leg of this trade sells an even further out of the money (25 delta) put.
* Sell a 25 delta monthly put.

The fourth and final leg of this trade purchases two even yet further out of the money (10 delta) puts, leaving the entire strategy long 3 options and short 3 options — the risk is well defined.
* Buy two 10 delta monthly puts.

What Does This Mean?
This is casually called a ratio spread, and specifically this is a 1 x 2 x 1 x 2 (read out loud as “1 by 2 by 1 by 2”) put spread.
The idea is to create an option position that creates a credit, has no upside risk (if the ETF rises it’s a winning strategy), has some downside bias (if the ETF goes down “a little” it profits at the maximum level), and finally covers the short positions with a final out of the money put purchase to limit total downside.
But, words do us little good, let’s just look at one trade, and the profit and loss graph exactly.
Here is a set of trades for a 6-year back-test in SPY, the top four lines are the opening trades, the bottom four lines are the resulting closing profit and losses.

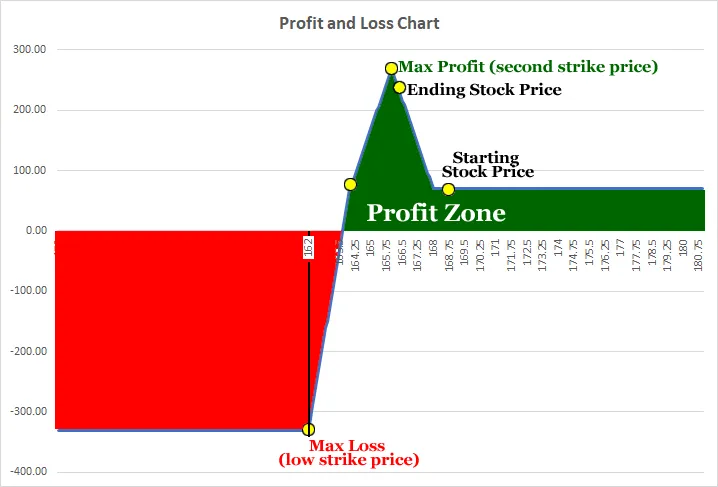
And here is how all of that looks in a profit and loss chart:
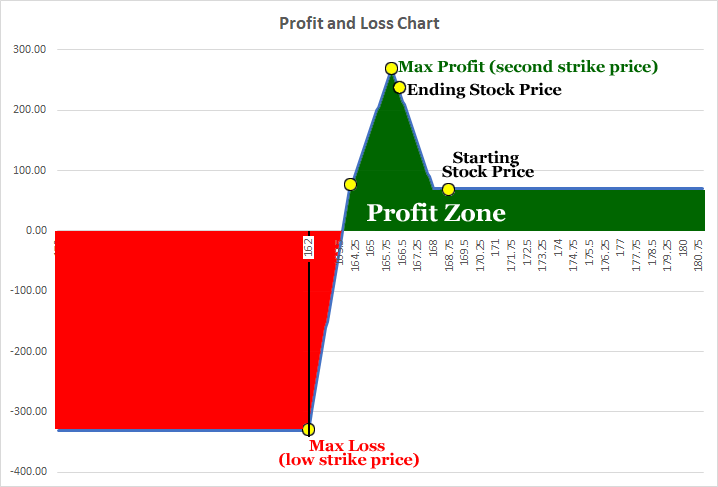
This strategy is profitable in the green shaded area, and shows a loss in the red shaded area.
To get your bearings:
* The maximum loss starts at the lowest strike price, in this case, $162. Any stock price there or lower shows a capped loss at its maximum.
* The maximum gain occurs right at the second-strike price (the first short strike price), in this case $166.
In English
This strategy does well in a bull market but does best in a slightly bearish market. It does worst when there is a large stock drop, but that loss is capped.
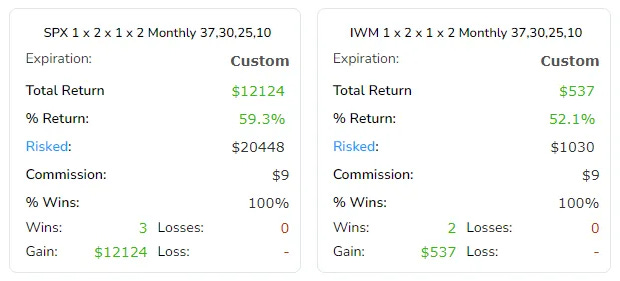
Now, here are the results over the last three- and one-years.
3-years

One-year
Alright, that’s it!
While we spend a lot of time on individual stock backtests, the cornerstone of option trading is volatility trading and the indices can be great vehicles to examine for this purpose.
Conclusion
There’s a difference between wanting something and liking the idea of something.
The difference is that one is for day dreams and the other is effort.
Legal
The information contained on this site is provided for general informational purposes, as a convenience to the readers. The materials are not a substitute for obtaining professional advice from a qualified person, firm or corporation. Consult the appropriate professional advisor for more complete and current information. Capital Market Laboratories (“The Company”) does not engage in rendering any legal or professional services by placing these general informational materials on this website.
The Company specifically disclaims any liability, whether based in contract, tort, strict liability or otherwise, for any direct, indirect, incidental, consequential, or special damages arising out of or in any way connected with access to or use of the site, even if I have been advised of the possibility of such damages, including liability in connection with mistakes or omissions in, or delays in transmission of, information to or from the user, interruptions in telecommunications connections to the site or viruses.
The Company makes no representations or warranties about the accuracy or completeness of the information contained on this website. Any links provided to other server sites are offered as a matter of convenience and in no way are meant to imply that The Company endorses, sponsors, promotes or is affiliated with the owners of or participants in those sites, or endorse any information contained on those sites, unless expressly stated.
