Lede
In recent years, a discernible trend has emerged in the stock price performance preceding the earnings announcements of prominent technology conglomerates such as Apple (AAPL), Microsoft (MSFT), and Alphabet (GOOGL), as well as leading banking institutions like JPMorgan Chase (JPM), Bank of America (BAC), Citigroup (C), and Wells Fargo (WFC).
This periodicity pattern has consistently yielded profitable results. Further, recent quarters seem to be amplifying the predictive strength of this signal, suggesting potential avenues for strategic investment.
Disclaimer: All of these results come from TradeMachine®, the proprietary option back testing platform from Capital Market Laboratories.
Preface
For several years, analysts at Capital Market Laboratories (CML) have identified recurring periodic trends within select clusters of equities, effectively capitalizing on volatility dynamics and stock price tendencies to generate favorable results for options traders.
In this instance, we share the outcomes of implementing a calendar call spread strategy within the mega tech and mega bank sectors.
This approach capitalizes on several pivotal factors: (i) the protective aspects of theta decay that are accentuated just before earnings events, (ii) the advantages derived from the customary theta decay witnessed in options that are not safeguarded by earnings, and simultaneously, (iii) reaping benefits from the persistent rise in stock prices fueled by pre-earnings enthusiasm.
Patterns and Theta Realities
Step 3:
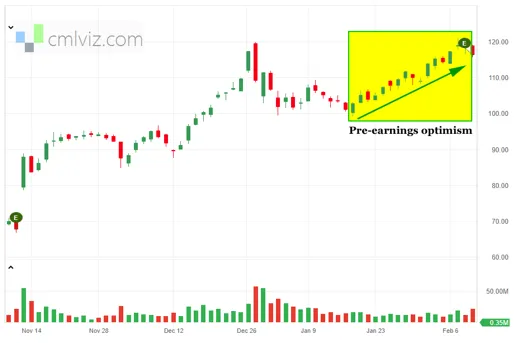
We start with point (iii) and an illustration of the pre-earnings optimism pattern in these stocks. An illustration is provided below:

We have observed, for over a decade now, that a handful of stocks, in particular mega cap tech and mega cap banks, show pre-earnings optimism two weeks before an earnings event in the stock price.
We wish to emphasize that the research we will share does not engage in earnings speculation; rather, the trading strategy under discussion is designed to conclude ahead of the earnings announcements.
The construct of the trade starts with an opening position 14-days before earnings and closes, at the latest, one-day prior to earnings:
Steps 1 and 2: In general, theta decay is nonlinear. This is an illustration of normal theta decay of an option:

The backtest we will examine makes use of this phenomenon, but then goes further.
Theta decay remains non-linear, but the shape of the decay is altered by an earnings event. We super impose theta decay before earnings (in the rectangle shape) on top of a standard option (no earnings), where the “E” represents the date of earnings.

It’s the distance between the curve and the rectangle that the calendar spread benefits from.
Finally, we take these three phenomena, and turn them into a backtest.
Formal Strategy
The backtest we constructed is comprised of two main components: firstly, assuming a long position in a call option that expires after-earnings, thereby benefiting from theta decay protection, and secondly, entering into a short position in a call option that expires prior to the earnings announcement, which allows us to harness the advantages of natural theta decay.
This bifurcated strategy aims to optimize potential returns while mitigating associated risks.
The formal strategy we tested was to get long a 50-delta (at-the-money) call that expires in about 14-days (and after earnings) while getting short a 30-delta (out of the money) call that expires in about a week but always before earnings.
The delta spread (50 to 30) is bullish, while the long call has theta protection, and the short call does not.
The trade is opened 14-days before earnings and closes when the short-dated option expires (about a week later).

Here is the calendar timing and action taken:

14-days before earnings is “day 1,” and both legs are opened.
About 7-days before earnings, when the short-dated option expires, the entire trade is closed.
Now we turn to the results.
Backtested Results
We start with the mega cap technology stocks over the last 5-years and look at the results:

Backtest Link
We can see that for each of the three mega cap tech stocks, the trade won 14/20 times, with total returns (wins and losses) ranging from 447% in MSFT to 206% in AAPL.
We then looked at this same backtest over the last year:

Backtest Link
All three stocks saw four wins and no losses over the period from 2022-09-04 to 2023-09-04.
We then did the same thing, but for the four mega cap banks stocks (JPM, BAC, C, WFC).
Here are the results over the last 5-years:

Backtest Link
The results in the four mega banks are similar to mega cap technology, with higher win rates and higher total returns.
Finally, we share the results over the last year for that same basket of stocks:

Backtest Link
And again, the results are quite strong.
We can then test the entire group as a portfolio (over the last year), using the same backtest strategy:

We see an 81.48%-win rate and an average one-week trade return of 34.2%.
If we then apply one more filter – our proprietary measure of one-year kurtosis, and require it to be greater than one, the results are fewer trades but vastly larger returns:

Backtest Link
The win rate stays about the same, the total number of trades reduces by 60% and the average return rises from 34% to 56% per week.
We can zoom out and look at the five-year results as well as a portfolio.
First, we look at the results without a filter for kurtosis:

Backtest Link
We see a 73%-win rate with an average one-week trade return of 26%.
Then we add the filter for one-year kurtosis greater than one and we get the following:

Backtest Link
The win rate rises slightly and the average trade return rises from 26% to 31%.
Actual Examples
While the actual trade data is reserved for TradeMachine ® members only, we share one example for illustrative purposes.
AAPL had earnings on 10-26-2022, and 14-days before then was 10-13-2022.
The option expiry to closest to 14-days from expiration but expiring after earnings was 10-28-2022.
The option expiry closest to 7-days after 10-13-2022 but expiring before earnings was 10-21-22.
So, on 10-13-2022, with the adjusted stock price at $142.15, the following two trades were opened:

That’s a calendar spread for $4.93 – $1.16 = $3.77 debit.
Then, on the day that the short dated options expired, 10-21-2022, this was the closing trade:

The spread closed at $6.05 – 0.40 = $5.65.
The long option went up in value from $4.93 to $6.05.
The short option went down in value from $1.61 to $0.40.
The total trade profit was $5.65 – $3.77 = $1.88.
The total profit return was $1.88/$3.77 = 49.9%.
Risk was exposed for eight calendar days.
We note that every trade for every backtest on every quarterly event is provided in TradeMachine as a record.
Conclusion
Leveraging the recurrent trend of pre-earnings optimism in the stock prices of mega-cap entities, encompassing both the technology and banking sectors, coupled with the exploitation of theta dynamics during earnings events, has consistently yielded robust outcomes.
Adding a filter for our proprietary kurtosis measure increases win rates and average returns over both one- and five-year periods.
These results on this strategy span far more than the mega caps, and we discuss and share that research in TradeMachine, going back over a decade.
To learn more about TradeMachine®, our backtesting software, you go here:
TradeMachine – The Who, What, Why, and How
The full featured software is provided both as an easy-to-use front end (a website) and as an API for customization with infrastructure inside AWS. TradeMachine allows for large scale customization on the one-hand, along with easy to use and nearly immediate results on the other.
Thanks for reading.
Legal
The information contained here is provided for general informational purposes, as a convenience to the readers. The materials are not a substitute for obtaining professional advice from a qualified person, firm or corporation. Consult the appropriate professional advisor for more complete and current information. Capital Market Laboratories (“The Company”) does not engage in rendering any legal or professional services by placing these general informational materials on this website.
The Company specifically disclaims any liability, whether based in contract, tort, strict liability or otherwise, for any direct, indirect, incidental, consequential, or special damages arising out of or in any way connected with access to or use of the site, even if I have been advised of the possibility of such damages, including liability in connection with mistakes or omissions in, or delays in transmission of, information to or from the user, interruptions in telecommunications connections to the site or viruses.
The Company makes no representations or warranties about the accuracy or completeness of the information contained here. Any links provided to other server sites are offered as a matter of convenience and in no way are meant to imply that The Company endorses, sponsors, promotes or is affiliated with the owners of or participants in those sites, or endorse any information contained on those sites, unless expressly stated.