Lede
We look at two triggers on the day driven by technical conditions and charts with backtested results.
Triggers, Charts, Backtests
We start with AMZN and use Pattern Finder to examine the 3-year chart while asking Pattern Finder to turn on the following settings:
- Trend Support (red line)
- Trend resistance (green line)
- Congestion points (pink lines)
- Target Zones (green and red shaded areas)
- Shapes
Here is the 3-year chart and we note that AMZN has one of our favorite patterns that we call “walking up rising support.”
This only happens as a stock rises and the support line is created by a series of higher lows.
See how the price has risen right in line with rising trend support drawn by Pattern Finder.

We zoom in for clarity on the most recent price movement and see that the upside target is 4.9% higher and the downside target is 1.9% lower, yielding a profit to loss zone of ~5:2.
That’s bullish with a stock rising up trend support.

This looks like a “not bearish” chart – which is to say, one could argue that it’s bullish, we’re feeling more like it reads as “perhaps bullish, but not bearish.”
For a stock trade, the set-up is as presented:
Upside target +4.9% (~$146); downside target -1.9% (~$135).
For option traders, “not bearish” can be translated into “short put spread.”
So, we gave that a look in TradeMachine.

Since AMZN just released earnings on Aug 3, we can take that timing into account.
We looked at the historical results of selling an out of the money put spread in AMZN 10 days after earnings and closing it 30 days after earnings.
Here is how it looks in TradeMachine.

AMZN is finally above the 200-day moving average, and we prefer to backtest short put spreads when the stock is out of technical failure (stock above the 200-dma), so we added that opening requirement:

And finally, the results:

Backtest Link
AMZN has been above the 200-day moving average 11 days after earnings three times in the last three-years and a short put spread was a winner all three times.
There you go. We went through this process:
chart —> walking up support —> target zones —> “not bearish” —> backtest
Next we turned to ticker MBLY, this time from the Today Tab in TradeMachine (which identifies backtests that are triggered on the day).

MBLY showed up on the “Bullish Bursts” scan for the day.
So, we took a look at the chart in Pattern Finder:

The stock is right on support and a congestion line all formed from the bottom of a cup – so a three way support.
It’s not the most bullish chart we have ever seen, but a combination of four technicals coincided to create the trigger in TradeMachine.
We zoom into the chart for clarity:

The stock trader has the plan: about 2.5% downside to stop and about 16% upside target.
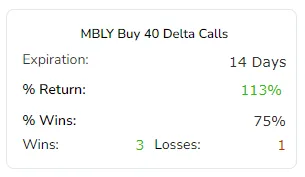
Option traders will go a step further, and look at the backtest that TradeMachine triggered:

That’s testing a long call when these four technical requirements are met:

This backtest also has a stop and limit:

And finally, we see the results; this occurred four times and three of them were winners:

Backtest Link
As a matter of taste, I like the AMZN set-up a little better, but that’s quite personal.
Conclusion
If you’re an option trader, I’d say “turn on the headlights” before entering a trade, and that’s what TradeMachine does for you.
Go this page to learn more about TradeMachine and watch a short video.
If options are not your cup of tea, then stocks likely are, and you can learn more about Pattern Finder here: Learn About Pattern Finder
Legal
The information contained on this site is provided for general informational purposes, as a convenience to the readers. The materials are not a substitute for obtaining professional advice from a qualified person, firm or corporation. Consult the appropriate professional advisor for more complete and current information. Capital Market Laboratories (“The Company”) does not engage in rendering any legal or professional services by placing these general informational materials on this website.
The Company specifically disclaims any liability, whether based in contract, tort, strict liability or otherwise, for any direct, indirect, incidental, consequential, or special damages arising out of or in any way connected with access to or use of the site, even if I have been advised of the possibility of such damages, including liability in connection with mistakes or omissions in, or delays in transmission of, information to or from the user, interruptions in telecommunications connections to the site or viruses.
The Company makes no representations or warranties about the accuracy or completeness of the information contained on this website. Any links provided to other server sites are offered as a matter of convenience and in no way are meant to imply that The Company endorses, sponsors, promotes or is affiliated with the owners of or participants in those sites, or endorse any information contained on those sites, unless expressly stated.