Preface
It’s time for more chart, skew and kurtosis, and backtesting analysis.
Charts
We started with the “Directional Charts” screen category and the “Bullish Charts; 3-yr Charts; Nearest Congestion or Trend” screen in Pattern Finder:
We made sure we looked at stocks with strength in their tail dynamics (we share a video at the end of this post to discuss why this is so crucial to assessing a trade).
We plucked out ticker CMPR, in the Commercial Services sector.
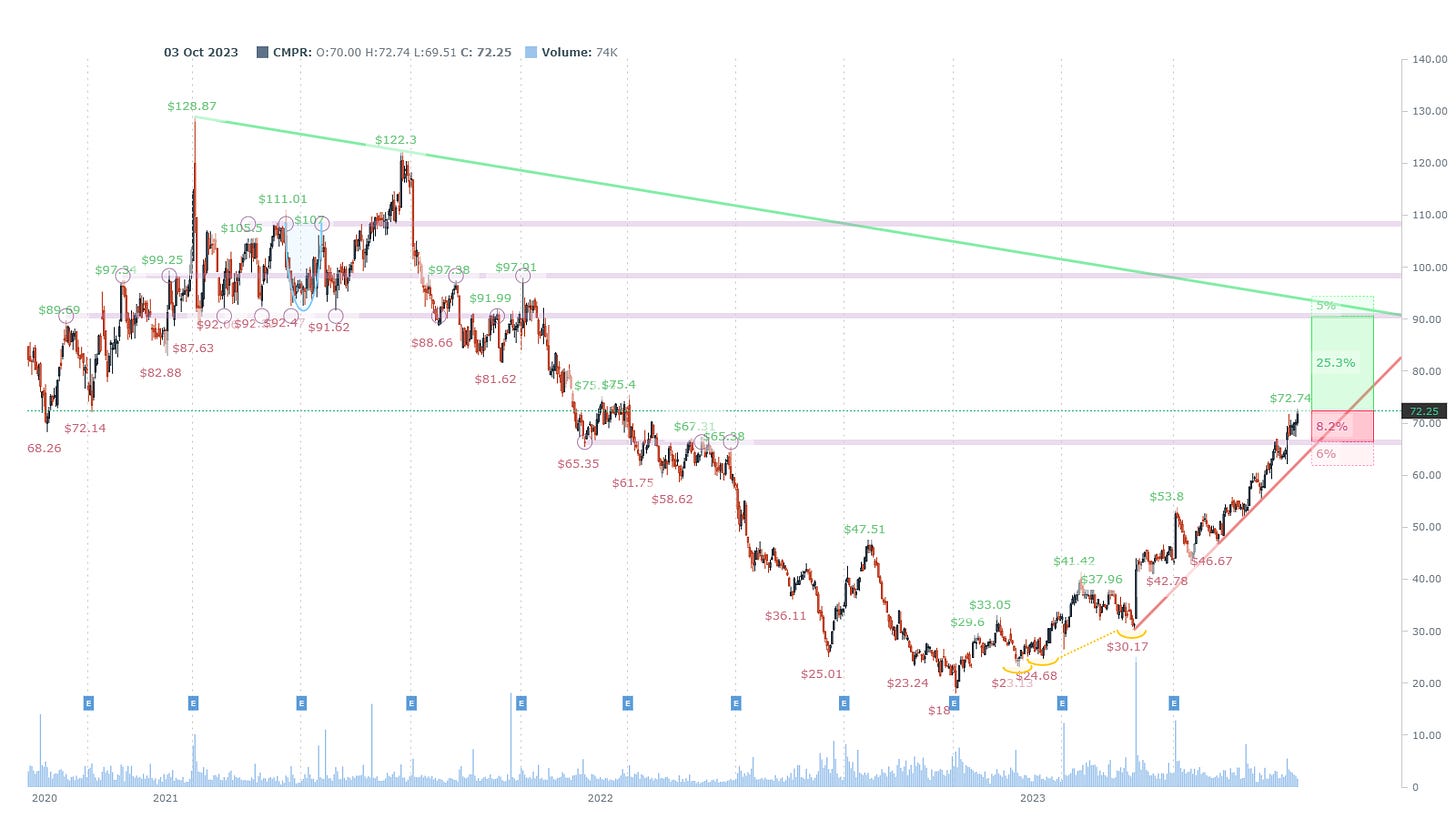
Here is the 3-year chart, note the rising trend support line (the red line), which Pattern Finder algorithmically creates off of a series of higher lows; and this time it was formed off of an ascending base.
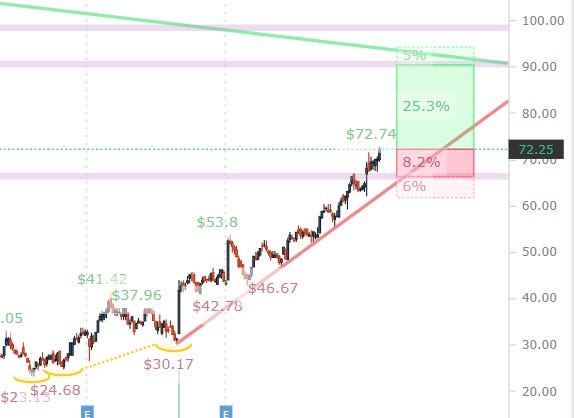
We zoom in to see the target zones more clearly and the recent ascending base. The next target upside zone is 25.3% and the downside zone is 8.2%, for a favorable return to risk ratio of greater than 3 to 1.
We look to the “Financial Stats” tab in Pattern Finder and expose the skew and kurtosis over the last s-x-months and one-year:
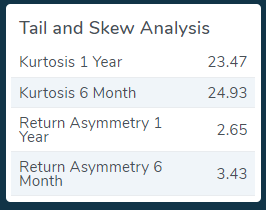
These are all positive, and the magic combination for stocks has been a 1-year kurtosis greater than 3 (we have that), a one-year skew greater than 2 (we have that), and six-month skew greater than 1 (and we have that).
As a reminder of just how powerful our proprietary skew and kurtosis measures have been, here are the results of a buy hold strategy from 2018-2023 (five-years), in two different groups of stocks.
First, we looked at four “non-growthy” sectors:
- Non Energy Minerals
- Consumer Durables
- Energy Minerals
- Utilities
And then only included companies with over $3B market cap.

A simple buy and hold of that entire group (about 200 companies) returned 17% per year.
Then we did the same strategy but only let a stock entire the portfolio if the three conditions held:
- 1-Year kurtosis > 1
- 1-year skew > 2
- 6-month skew > 1
The average annual return rose from 17% to 45%. Yes, that’s long stock, per year. No options; just long stock in midcap to large cap stocks in a rather non-sexy selection of sectors.
Yeah, it matters that much.
And yes, we have begun the process of opening a fund to trade these propriety dynamics.
When we turn to TradeMachine, our next step up from Pattern Finder with a full blown option backtesting engine.
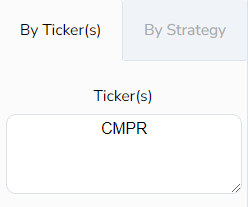
We went to the Pro Scan tab and simply asked TradeMachine to go “By Ticker” for successful backtests in CMPR over the last 3-years:
And here are the option strategies that have worked historically for ticker CMPR:
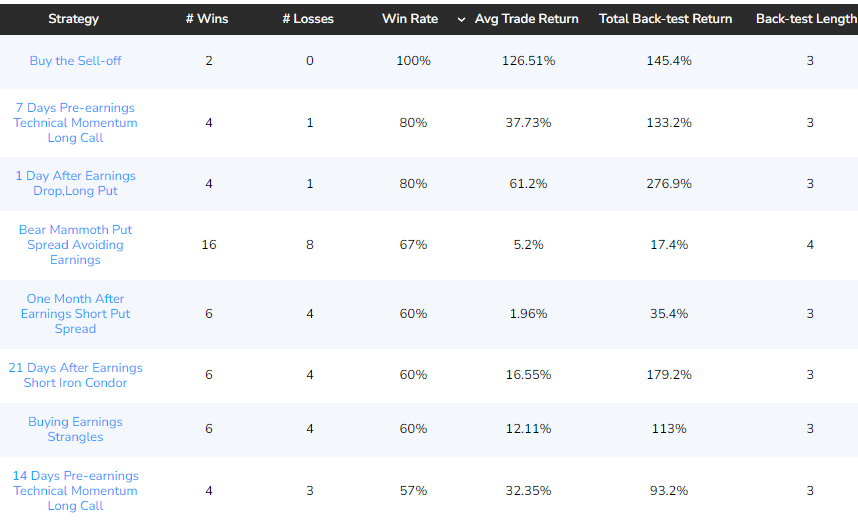
We leave the details of those backtests (the actual triggers and technical set-ups) to TradeMachine members.
We did the same thing (same buy and hold strategy) for the S&P 500 over the same five-years and saw the average annual return double from 10% to 20%.
Again, yes, it matters that much and this why we note the dynamics with every chart.
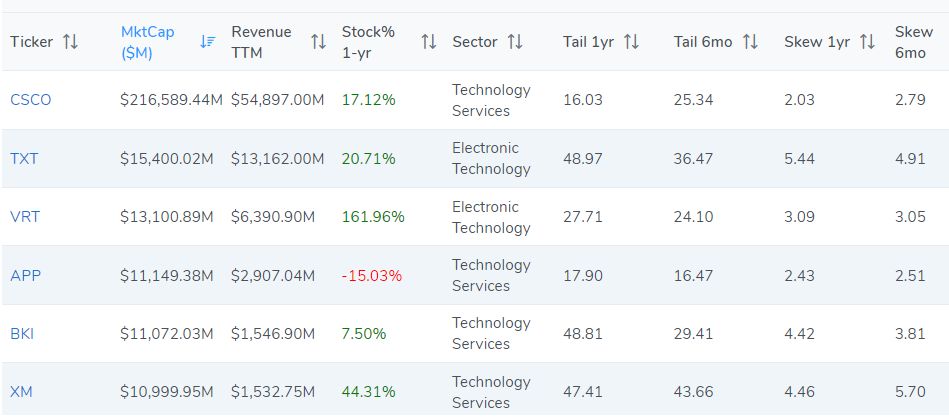
As for a list of other stocks and charts to peruse, we share the results of one of my own screens in Pattern Finder which I named “Strong Skew, Kurtosis, Stock – Tech Larger.”
Here are the filters:
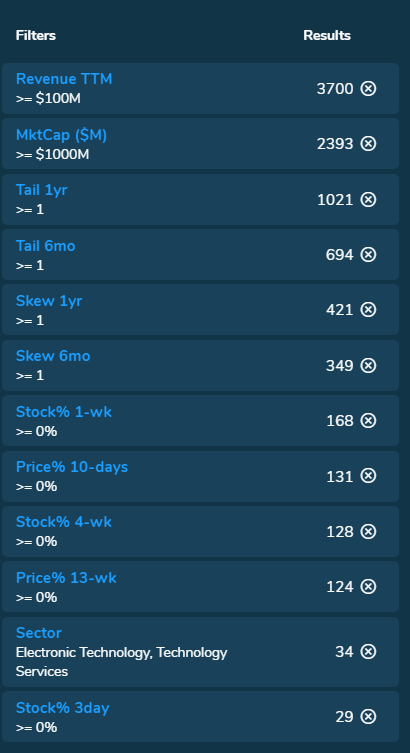
We’re looking at tech stocks over $1B in market cap that have both strong return distribution dynamics and have been in a recent up trend.
Conclusion
The data and rationale behind the remarkable finding we have discovered surrounding our proprietary skew and kurtosis can be found below:
Go this page and scroll to the middle of the page for the video.
It looks like this:
Legal
The information contained on this site is provided for general informational purposes, as a convenience to the readers. The materials are not a substitute for obtaining professional advice from a qualified person, firm or corporation. Consult the appropriate professional advisor for more complete and current information. Capital Market Laboratories (“The Company”) does not engage in rendering any legal or professional services by placing these general informational materials on this website.
The Company specifically disclaims any liability, whether based in contract, tort, strict liability or otherwise, for any direct, indirect, incidental, consequential, or special damages arising out of or in any way connected with access to or use of the site, even if I have been advised of the possibility of such damages, including liability in connection with mistakes or omissions in, or delays in transmission of, information to or from the user, interruptions in telecommunications connections to the site or viruses.
The Company makes no representations or warranties about the accuracy or completeness of the information contained on this website. Any links provided to other server sites are offered as a matter of convenience and in no way are meant to imply that The Company endorses, sponsors, promotes or is affiliated with the owners of or participants in those sites, or endorse any information contained on those sites, unless expressly stated.
