Lede
Don’t miss out on the rally no one sees coming.
Today we got the CPI report and it was spectacular news.
- CPI MoM came in negative (-0.1%) for the first time since 2020.
- CPI YoY (3.0%) is at a multi-year low.
- Core CPI YoY (3.2%) is at a multi-year low.
- Housing inflation is at a multi-year low.
- Prices for core services excluding housing -0.1% MoM; multi-year low.
Story
For the second month in a row, headline CPI MoM was 0.0% or lower.
Nick Timiraos noted that the three-month annualized Core CPI dropped to 2.1% in June, marking its lowest level since COVID.
The rent lag I have written about now for over six-months is finally barely catching up with reality.
Here is a chart of housing inflation:

Further, prices for core services excluding housing came in at -0.1% MoM, the lowest since August 2021.
Here is the chart for Owners Equivalent Rent (OER), which is still obtusely high and lagged but continuing its march lower:

And is there more room to go with this obtuse measure? Yes, a lot of room.
Here is the measure of rent in CPI versus the new index created by the Bureau of Labor Statistics (BLS) itself:

There is still substantial disinflation coming. I note again, that the shelter component of CPI makes up 34% of Core CPI and 18% of Core PCE.
Ernie Tedeschi pointed out that housing inflation slowed from 0.42% to 0.27% MoM. The 0.27% figure aligns with pre-pandemic averages.
When we exclude shelter, CPI and PCE have been at target for more than 12-months.
This is a chart of Core CPI using the monthly annualized rate and the three-month annualized rate from Jason Furman:

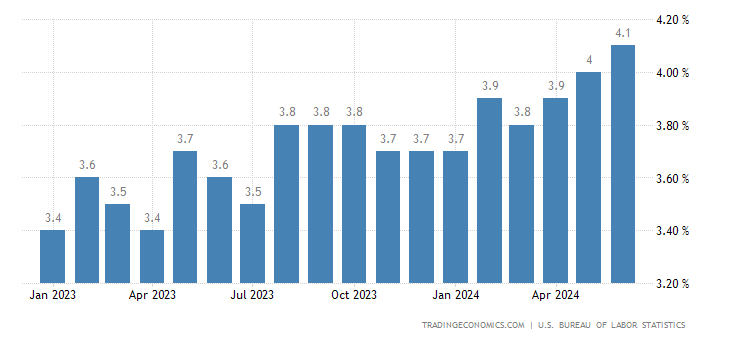
Here is a 10-year chart of Core Inflation (YoY)
US Core Inflation Rate (Core CPI YoY) 10-Year chart (Source)
")
Inflation is over. The trajectory is decidedly down, with CPI, Core CPI, PCE, and Core PCE all at multi-year lows.
This, all while the unemployment rate is at multi-year highs and continuing jobless claims are near multi-year highs.
Unemployment Rate
The savings rate is at multi-year lows, credit card delinquencies are at multi-year highs, GDP growth is slowing, and real personal disposable income growth is slowing.
US Household cumulative excess savings

Credit Card Delinquencies

The dual mandate, jobs and prices, is equal weighted.
One is not more important than the other in the eyes of the law.
It’s time for the Fed to focus on the portion that is moving in the wrong direction, not the one moving in the right direction.
This is a slide from the last CML Pro webinar held six days ago:

The futures market agrees, as the probability of a rate cut in September has risen to 90%, with the probability of rates being 50 bps lower now at 7%.

Treasury yields have fallen across the board on the CPI news as well:

Finally, here is a summary of all of the data today and how it lines up versus analyst estimates:
Data Lede
- US Inflation Rate (CPI YoY):
- 3% vs 3.1% consensus and 3.3% prior.
- US Inflation Rate (CPI MoM):
- -0.1% vs 0.1% consensus and 0% prior.
- US Core Inflation Rate (Core CPI YoY):
- 3.3% vs 3.4% consensus and 3.4% prior.
- US Initial Jobless Claims:
- 222K vs 236K consensus and 239K prior.
- US Continuing Jobless Claims:
- 1852K vs 1860K consensus and 1856K prior.
- US Jobless Claims 4-week Average:
- 233.5K and 238.75K prior.
Conclusion
What the Fed thinks about inflation and the underlying economic data is the only thing that matters.
I’ll repeat that: What the Fed thinks is the only thing that matters – the data has not mattered.
It’s time to cut rates.
If we don’t get a cut by September at the latest, here should be consideration of an impeachment of Chairman Powell.
Thanks for reading, friends.
Now is the perfect time to join CML Pro and prepare for the “After This” winners. Our exclusive stock picks have delivered a 272% return since 2016, far surpassing the NASDAQ, ARKK, and S&P 500.

Just today the small cap Russell 2000 is up 3%, while the maga cap tech index NASDAQ 100 is down 1%.
This is what happens when the market broadens out.
We have 13 top picks. 600 institutions have them. Don’t miss out on the rally no one sees coming.
You can too. http://bit.ly/CMLPro

Legal
The information contained on this site is provided for general informational purposes, as a convenience to the readers. The materials are not a substitute for obtaining professional advice from a qualified person, firm, or corporation. Consult the appropriate professional advisor for more complete and current information. Capital Market Laboratories (“The Company”) does not engage in rendering any legal or professional services by placing these general informational materials on this website.
The Company specifically disclaims any liability, whether based in contract, tort, strict liability or otherwise, for any direct, indirect, incidental, consequential, or special damages arising out of or in any way connected with access to or use of the site, even if I have been advised of the possibility of such damages, including liability in connection with mistakes or omissions in, or delays in transmission of, information to or from the user, interruptions in telecommunications connections to the site or viruses.
The Company makes no representations or warranties about the accuracy or completeness of the information contained on this website. Any links provided to other server sites are offered as a matter of convenience and in no way are meant to imply that The Company endorses, sponsors, promotes or is affiliated with the owners of or participants in those sites, or endorse any information contained on those sites, unless expressly stated.