7/5/2024
Reminder: The CML Pro quarterly webinar is tomorrow at 11a PT / 2pm ET.
You can register here: CML Pro Webinar: 7-6-2024
The webinar will be recorded and automatically emailed; there is is no need to email support.
Lede
Today, we received the Non-Farm Payroll (NFP) report, providing data on unemployment and various other measures of the labor market.
- Total payrolls beat estimates; prior months revised down 111K.
- Private payrolls missed estimates.
- Wage inflation is at the lowest level since pre-COVID.
- The unemployment rate rose and is the highest in three years
- The participation rate rose as much as unemployment rate so the employment rate is unchanged.
- It’s apparent now that the US needs far more payroll additions monthly to sustain a 4% unemployment rate as labor dynamics have changed.
While total non farm payrolls beat estimates rather handily (206K vs 190K estimates and 218K prior), private payrolls came in soft at 136K versus estimates for 160K and 193K prior.
Here are United States Nonfarm Payrolls – Private

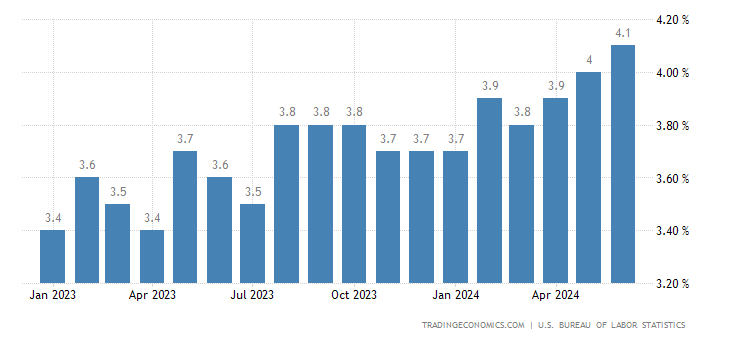
The unemployment rose again to a new cycle high of 4.1%, a level not seen sine Nov 2021, while wage inflation YoY came in at a multi year low last seen pre-COVID.
I note that the participation rate also rose by 01.%, so while the unemployment level rose by 0.1%, the employment rate was unchanged.
Ernie Tedeschi pointed out on Twitter that pre-pandemic, it was believed that we needed around 100K additional jobs per month to keep the unemployment rate steady.
However, in the past three months, the United States has averaged an addition of 177K jobs per month, yet the unemployment rate has still risen by 0.23 percentage points.
This points to (potentially) higher job growth requirements to keep the unemployment level steady.
Here is the unemployment rate; note the rise:
US Unemployment Rate 18-Month chart (Source)
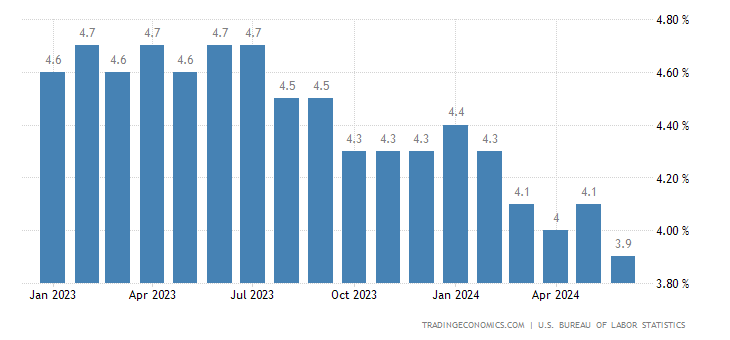
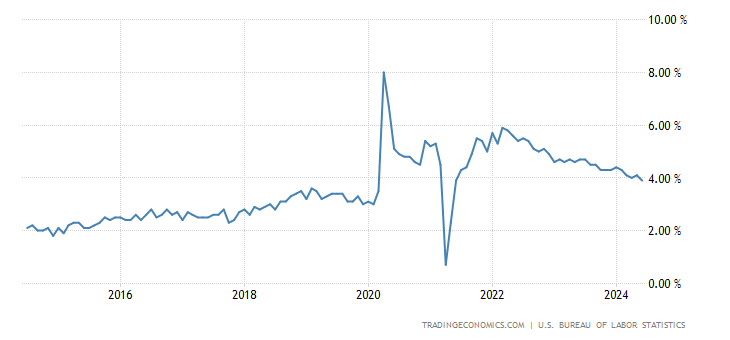
Here is annual wage inflation over the last 18-months and 10-years; note the drops:
US Average Hourly Earnings YoY 18-Month chart (Source)
US Average Hourly Earnings YoY 10-Year chart (Source)
- US Non Farm Payrolls:
- 206K vs 190K consensus and 218K prior.
- US Average Hourly Earnings YoY:
- 3.9% vs 3.9% consensus and 4.1% prior.
- Lowest since pre-pandemic.
- US Average Hourly Earnings MoM:
- 0.3% vs 0.3% consensus and 0.4% prior.
- US Average Weekly Hours:
- 34.3 vs 34.3 consensus and 34.3 prior.
- US Unemployment Rate:
- 4.1% vs 4% consensus and 4% prior.
- Highest since Nov 2021.
- US Labor Force Participation Rate:
- 62.6% and 62.5% prior.
Preface
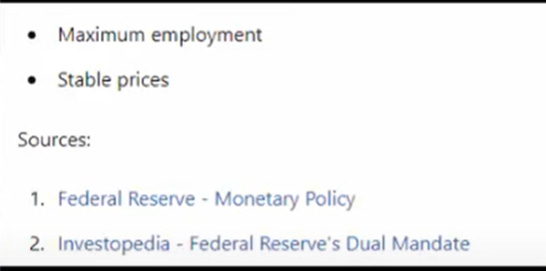
The Federal Reserve has a dual mandate, which entails overseeing both the employment market, ensuring people have jobs, and controlling inflation.
From the non farm payroll (NFP) report we see the unemployment rate is 4.1% up from a low of 3.4%.
US Unemployment Rate 18-Month chart (Source)

Earlier this week, we learned that continuing jobless claims are rising, reaching their highest level since 2021:
Continuing Jobless Claims (Source)

And now we see private payrolls cooling.
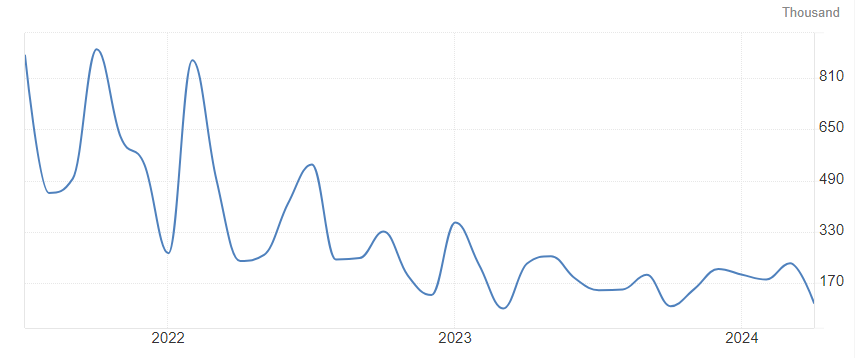
With three data points together— dropping private payrolls, higher unemployment, rising continuing jobless claims—the “maximum employment” portion of the Fed’s dual mandate is in violation.
This violation is permissible if the price stability mandate is also in violation.
While the Fed believes the price stability (inflation target) has not been met, I disagree, and here’s why:
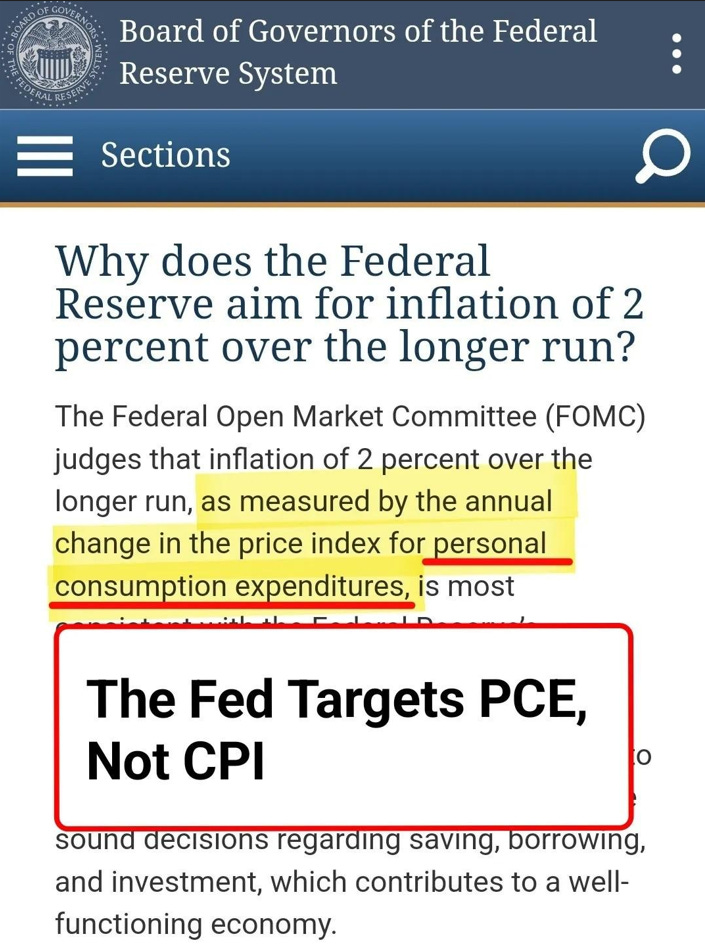
I emphasize again that the PCE index is the inflation measure the Fed targets at 2%. Here is a screenshot from the Fed Governors’ website:
I further emphasize my view that inflation has already been at the Fed’s target for over a year when adjustments are made for the lagged measure of housing.
Here are Core PCE annualized rates excluding shelter (from Jason Furman on Twitter):
- 1 month: 0.1%
- 3 months: 2.2% ← Target achieved
- 6 months: 2.8%
- 12 months: 2.0% ← Target achieved
If the Fed induced a recession now by maintaining excessively restrictive monetary policy—essentially keeping interest rates too high—it would be wholly unacceptable. Furthermore, I believe this could warrant the impeachment of Chairman Powell, given that the Fed has a 2% inflation target.
Cost of shelter is a fancy way of saying rent.
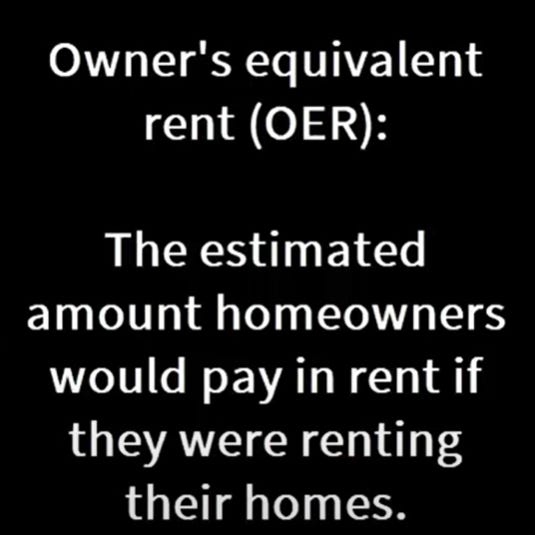
The owner’s equivalent rent or what you’ll see in the news as “OER.” is simply the estimated rent a homeowner would pay if they were renting their home instead of owning it.
Homeowners are only polled once every six months about the rental value of their homes, and leases typically renew once a year.
This creates a significant lag in the shelter component used to compute inflation, whether it’s CPI, PCE, or any other measure.
This lag results in a discrepancy between actual conditions and the data the Federal Reserve reacts to.
If the Federal Reserve continues to respond to these lagged numbers while the unemployment rate and jobless claims rise, we risk falling into a recession.
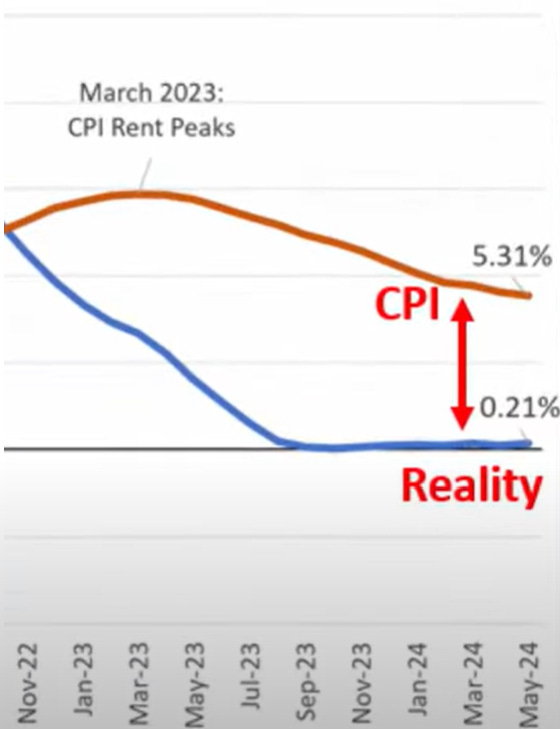
If we adjust it for real-time shelter, here’s a chart of rent in the inflation measure.
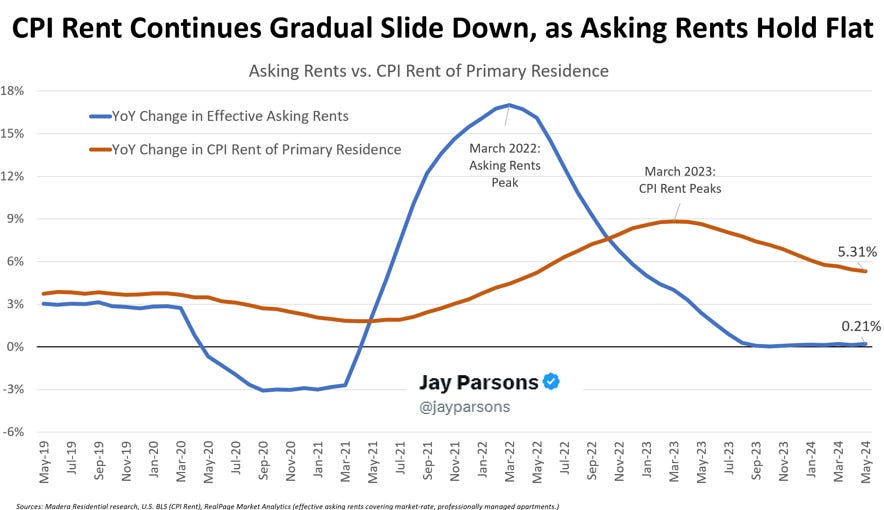
The numbers the Federal Reserve is reacting to, shown in orange, indicate a year-over-year inflation rate of 5.31%, which is high compared to the actual asking rents.
The inflation rate for new leases each month is 0.2%, which is almost zero.
This 5.1% difference accounts for one and a half points of inflation. Adjusting for this, we would be at the Fed’s target.
There is a measure called the harmonized CPI, which relies solely on actual market prices, not lagged prices, unlike the standard CPI.

And if you’re thinking, gosh, does the Fed know about this? Yes, they do.
They produce the data and share it every month. Here’s a chart.
Harmonized CPI
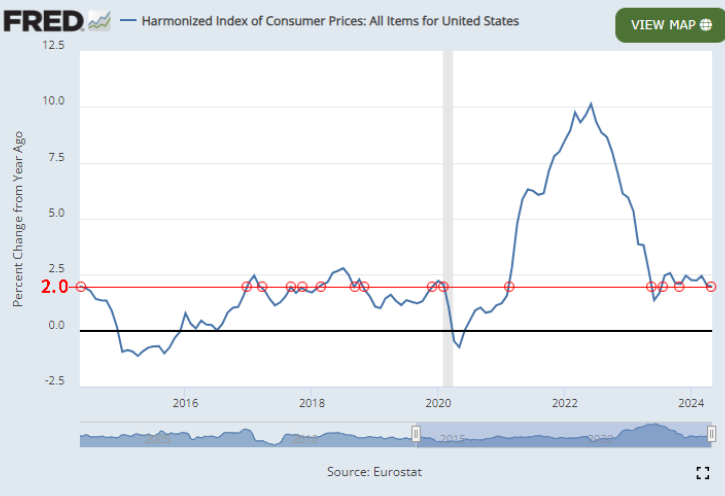
Not only is the harmonized CPI currently at 2%, but it was also at 2% six months ago, ten months ago, and twelve months ago. This level is consistent with pre-COVID years, including 2019, 2018, 2017, 2016, and even 2014. We are maintaining a 2% inflation rate.
The next chart, represented by either the yellow line or the blue line, illustrates the level of rent inflation used in the inflation indexes.
There’s either a CPI or PCE, and you ask yourself, well, what’s that black line?

The black line represents a new measure introduced by the Bureau of Labor Statistics, where all this inflation data originates.
In late 2022, researchers at the BLS and the Cleveland Fed introduced an experimental quarterly index of new tenant rent.

They called it, cleverly, the “new tenant rent index.”
It uses a method very similar to the Zillow index and data from the CPI housing survey, which are both in real-time.
What do we see? Once again, the black line, representing real-time rents, shows that the actual cost of shelter is near zero, while traditional inflation measures have it over 5%.
So why do I think inflation is already at the 2% target? Well, I’ve shown you three charts.
Finally, here’s a fourth chart.
This is, very simply, in orange inflation and in the blue line inflation excluding shelter.
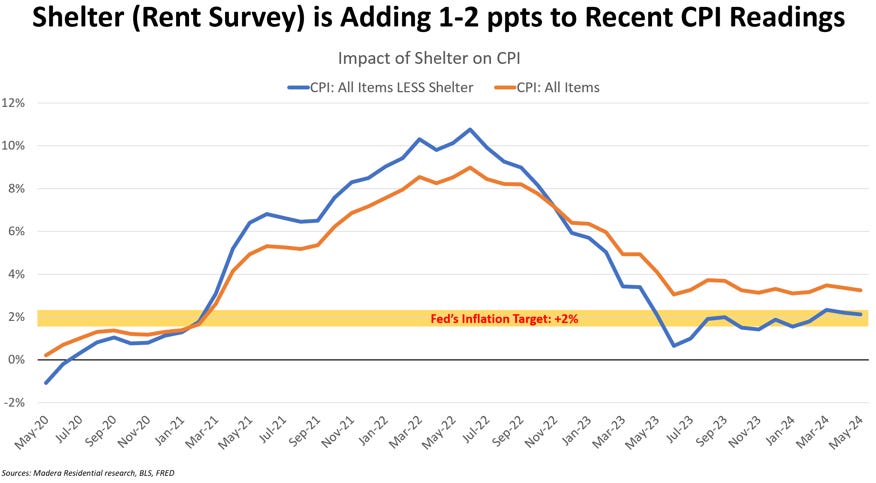
Wage inflation is now at a multi-year low.
Here is how treasury yields are reacting:

The probability of a rate cut in the September FOMC meeting has risen to 75%.
The actual inflation measure is at 2%, and as I mentioned earlier, it has been at this level for some time. As of June 2024, this was evident as early as April 2023.
Meanwhile, credit card delinquencies are rising, the savings rate is dropping, real disposable personal income growth is declining, GDP growth is slowing, the unemployment rate is increasing, and continuing jobless claims are at a multi-year high.
There is no justification for a Federal Reserve-induced recession at this point. It is time for the Fed to cut rates.
Conclusion
What the Fed thinks about inflation and the underlying economic data is the only thing that matters.
I’ll repeat that: What the Fed thinks is the only thing that matters – the data has not mattered.
It’s time to cut rates, and waiting until September takes an unnecessary risk that we will turn to recession given that the unemployment rate has risen to 4.1% from 3.4%. Further, 43% of small businesses in the US were unable to fully pay their rent in April, the highest share since March 2021.
With PPI MoM -0.2%, Core PPI 0.0% MoM, Core CPI YoY the lowest since April 2021, Core CPI MoM the lowest since August 2021, headline CPI MoM the lowest since 2020, and now Core PCE YoY the lowest since March 2021…
… If we get another PCE, CPI, PPI report as we did in the last month, and the unemployment rate ticks up again, there should be consideration of an impeachment of Chairman Powell if the Fed does not cut rates in September and does not move its stance to considerably more dovish.
There are lots of “ifs” in there, but a monetary policy induced recession would be wholly unacceptable in that scenario; wholly unacceptable.
For a fuller discussion and to look into long-term stock research please learn more about CML Pro:
CML Pro is Proudly Utilized By 500+ Of The World’s Largest Financial Institutions:

And has delivered serious returns for serious Investors:
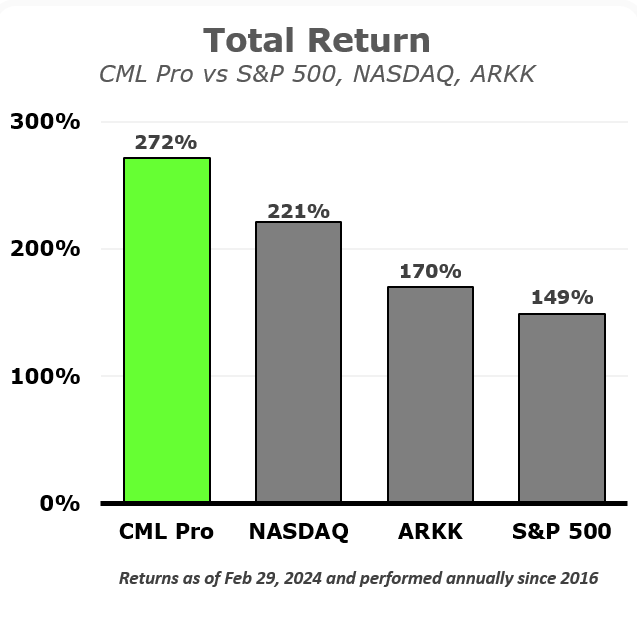
Learn more here and watch a short but instructive video here.
Thanks for reading, friends.
Legal
The information contained on this site is provided for general informational purposes, as a convenience to the readers. The materials are not a substitute for obtaining professional advice from a qualified person, firm or corporation. Consult the appropriate professional advisor for more complete and current information. Capital Market Laboratories (“The Company”) does not engage in rendering any legal or professional services by placing these general informational materials on this website.
The Company specifically disclaims any liability, whether based in contract, tort, strict liability or otherwise, for any direct, indirect, incidental, consequential, or special damages arising out of or in any way connected with access to or use of the site, even if I have been advised of the possibility of such damages, including liability in connection with mistakes or omissions in, or delays in transmission of, information to or from the user, interruptions in telecommunications connections to the site or viruses.
The Company makes no representations or warranties about the accuracy or completeness of the information contained on this website. Any links provided to other server sites are offered as a matter of convenience and in no way are meant to imply that The Company endorses, sponsors, promotes or is affiliated with the owners of or participants in those sites, or endorse any information contained on those sites, unless expressly stated.