Preface
Today we received the non farm payrolls (NFP) report for May.
(i) Non farm payrolls beat estimates
(ii) Average hourly earnings came in hotter than estimates
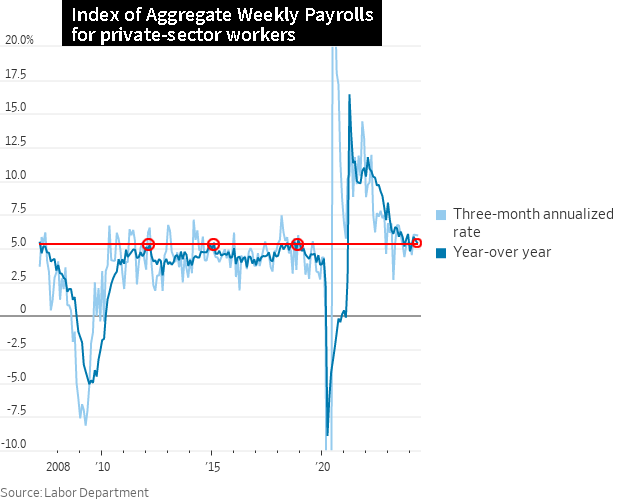
(iii) The 12-month payroll index has grown 5.4% YoY, which is inline with the 2018 cycle and versus 6%-6.5% last year.
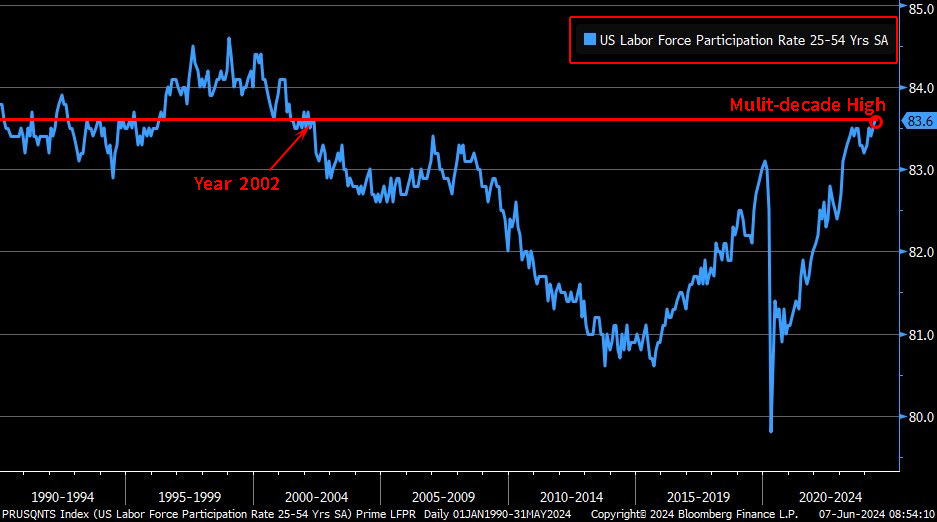
(iv) Prime age labor force participation is now at a multi-decade highs
(v) The United States is at full employment
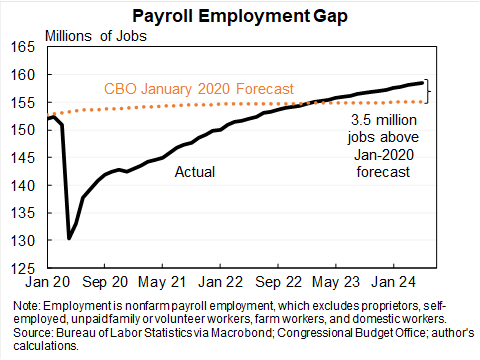
(vi) Current jobs are significantly above those levels predicted before COVID.
(vii) The unemployment rate has risen from a low of 3.4% to now 4.0%, steadily, so there is loosening in the job market.
Here are the takeaways in bullets, before we get into analysis:
- Non Farm Payrolls
- 272K vs 185K consensus and 165K prior.
- Average Hourly Earnings YoY:
- 4.1% vs 3.9% consensus and 4% prior.
- Prime Age Labor Participation
- Multi-decade high
- 12-Month Payroll Index Growth 5.4%
- Previous Year Range: 6%-6.5%; aligns with 2018 peak cycle levels
- Current Jobs and Employment Status
- Significantly exceeds pre-pandemic CBO projections
Story
The US native-born population is aging (Boomers) and increasingly likely to retire. A way to account for this demographic reality while avoiding bad takes and catastrophizing is through the the employment-to-population (EPOP).
The employment-to-population (EPOP) ratio measures the proportion of a country’s working-age population that is employed
EPOP ratio for prime-age (25-54) native-born workers is currently higher than it was before the pandemic and before 2008.
Here is a chart from Ernie Tedeschi, the former Chief Economist at the White House Council of Economic Advisers (CEA):
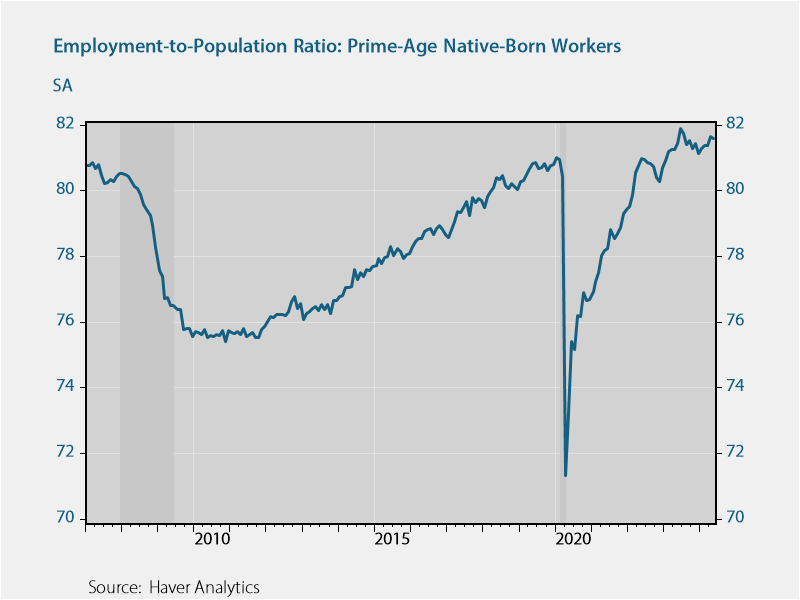
That chart and its toppy behavior likely indicates that the United States is currently at full employment, a very good place to be.
Age-adjusted employment-to-population ratio consistent with the year 2000, leaving little room for further increases in EPOP under current policies.
(Full employment is an economic condition in which virtually all individuals who are willing and able to work are able to find employment. It doesn’t imply a zero unemployment rate.)
Here is that age adjusted chart (same source):
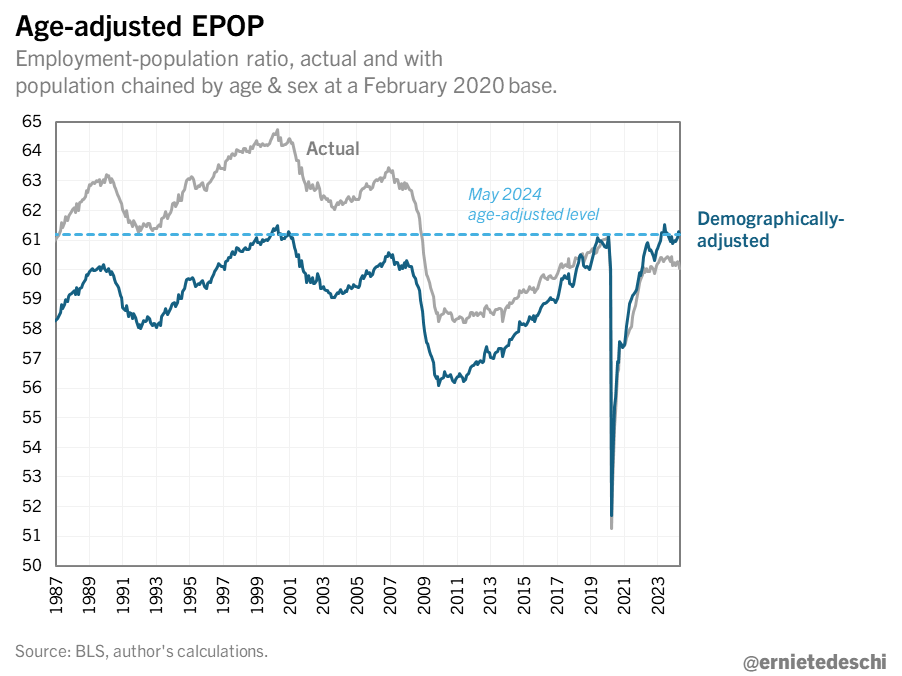
This is also reflected in the simpler to understand measure: prime age labor force participation (the percentage of individuals aged 25-54 who are either employed or actively seeking employment).
Here is a chart from Liz Ann Sonders (Chief Investment Strategist, Charles Schwab) where we see a multi-decade high:
Turning to the wage inflation piece, we get a chart from Nick Timiraos (Chief economics correspondent, The Wall Street Journal) which shows how the year over year total payroll wage growth is now at levels seen multiple times in the last decade:
Finally, we see that the US economy’s labor market is performing significantly better than the estimates that were made by the Congressional Budget Office pre-COVID:
This chart is from Jason Furman (Professor of Practice at Harvard, Senior Fellow PIIE, former Chair of President Obama’s CEA).
If this seems like all good news, don’t worry there is the other side.
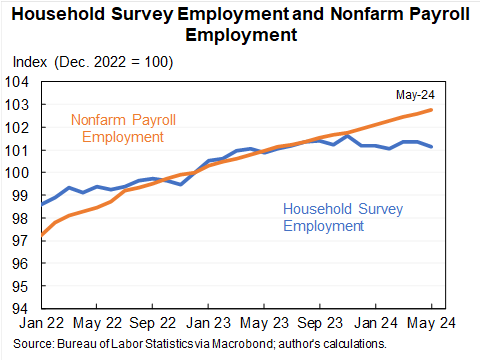
Household employment data showed a drop of 456K jobs versus the NFP report which showed a 272K gain.
Household employment data is derived from surveys of individuals, captures all forms of employment including multiple job holders and agricultural work, while non-farm payroll data, collected from employers, focuses on job counts in non-agricultural sectors excluding multiple job holders and self-employed individuals.
May full-time employment dropped by 625k (largest drop since December 2023) while part-time employment rose 286k.
Here is a chart from Jason Furman showing the discrepancies.
In all, we see evidence again, that the US job market is remarkably strong, at multi-decade highs for prime age labor force participation, and once accounting for the reality of aging demographics (and retirements) likely indicates that the United States is currently at full employment, a very good place to be.
The employment market is strong, and, for all those identity politic types, we’re sorry to say that the job market was great under a Trump white house and is now great under a Biden white house.
It ain’t who’s president, friends, it’s the republic – the U.S. is exceptional.
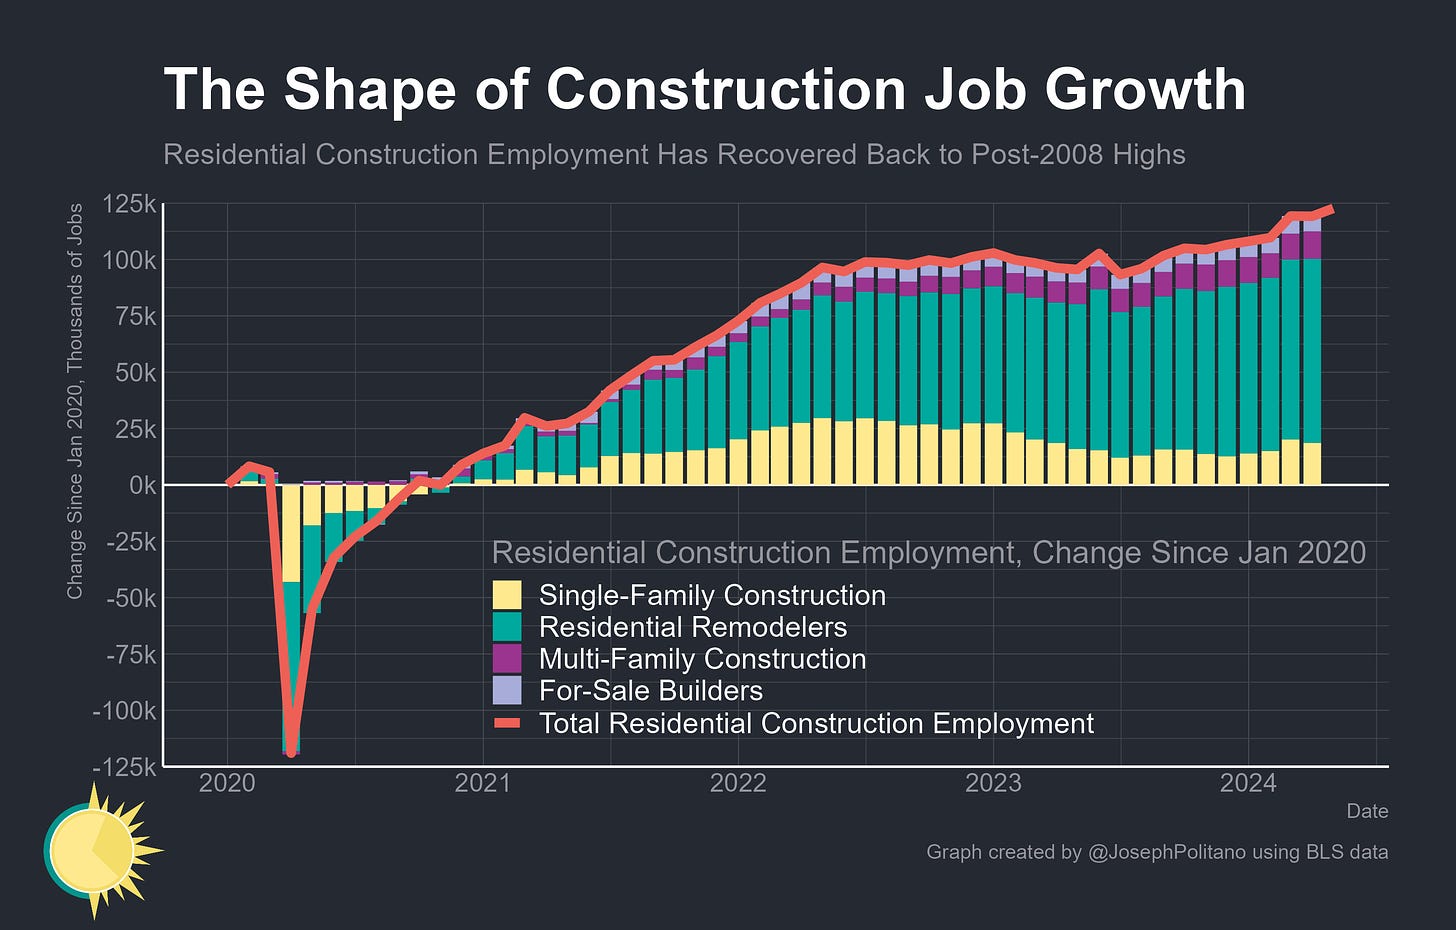
As an aside, US residential construction rose to another post-2008 high, and is up 27k over the last year.
Here is a chart from Joseph Politano:
With better than expected jobs growth in NFP, but also higher wage growth, the rate market is higher:
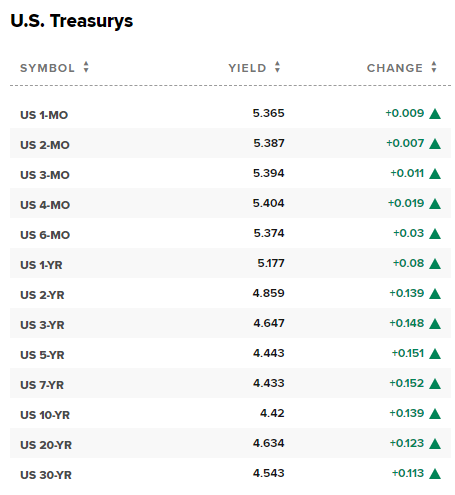
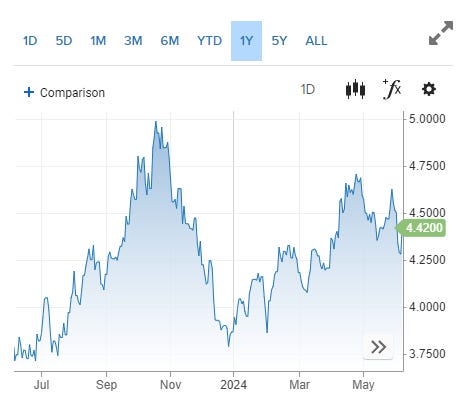
The yield on the 10-year Treasury note is still considerably below highs in the last year:
The probability of a rate cut in the September 2024 FOMC meeting is 54% and July now stands at just 9%.
Please find the data summarized below:
Data Lede
- US Non Farm Payrolls:
- 272K vs 185K consensus and 165K prior.
- US Average Hourly Earnings YoY:
- 4.1% vs 3.9% consensus and 4% prior.
- US Average Hourly Earnings MoM:
- 0.4% vs 0.3% consensus and 0.2% prior.
- US Average Weekly Hours:
- 34.3 vs 34.3 consensus and 34.3 prior.
- US Unemployment Rate:
- 4% vs 3.9% consensus and 3.9% prior.
- US Labor Force Participation Rate:
- 62.5% and 62.7% prior.
- US Wholesale Inventories MoM:
- 0.1% vs 0.2% consensus and -0.5% prior.
- US Used Car Prices YoY:
- -12.1% and -14% prior.
- US Used Car Prices MoM:
- -0.6% and -2.3% prior.
Conclusion
What the Fed thinks about inflation and the underlying economic data is the only thing that matters. The economy appears to be healthy but there are signs of consumer weakening.
For a fuller discussion and to look into long-term stock research please learn more about CML Pro:
CML Pro is Proudly Utilized By 500+ Of The World’s Largest Financial Institutions:

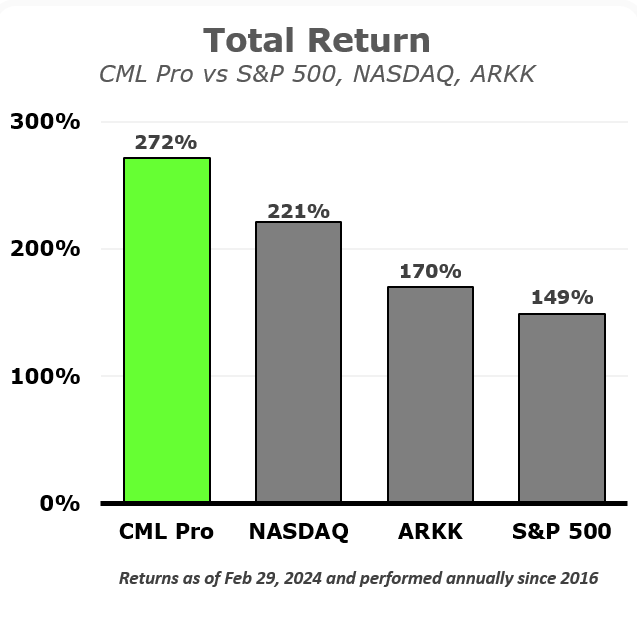
And has delivered serious returns for serious Investors:
Learn more here and watch a short but instructive video here.
Thanks for reading, friends.
Legal
The information contained on this site is provided for general informational purposes, as a convenience to the readers. The materials are not a substitute for obtaining professional advice from a qualified person, firm or corporation. Consult the appropriate professional advisor for more complete and current information. Capital Market Laboratories (“The Company”) does not engage in rendering any legal or professional services by placing these general informational materials on this website.
The Company specifically disclaims any liability, whether based in contract, tort, strict liability or otherwise, for any direct, indirect, incidental, consequential, or special damages arising out of or in any way connected with access to or use of the site, even if I have been advised of the possibility of such damages, including liability in connection with mistakes or omissions in, or delays in transmission of, information to or from the user, interruptions in telecommunications connections to the site or viruses.
The Company makes no representations or warranties about the accuracy or completeness of the information contained on this website. Any links provided to other server sites are offered as a matter of convenience and in no way are meant to imply that The Company endorses, sponsors, promotes or is affiliated with the owners of or participants in those sites, or endorse any information contained on those sites, unless expressly stated.
