Lede
Inflation came in a bit softer than expectations while personal spending and real disposable income came in soft as well. The Fed is likely headed for a rate cut this Fall.
This all comes after our prior note on May 15th which forecasted much of this data today:
CPI in line; Drops for first time in 2024; Consumer weakening
In general, we view this as good news on the inflation front, but we are a little cautious around economic data.
We’ll call it bullish with an asterisk (of risk).
The availability of CML Pro to retail investors may be going way permanently soon.
Get CML Pro, even if it becomes unavailable to non-professional investors here: https://bitly.com/CMLPro. Join the investors that are looking to the “After This” future with CML Pro.
CML Pro is utilized by over 500 of the world’s largest financial institutions

And has been delivering serious returns for investors over the last 8 years with auditor verification performed annually.

Story
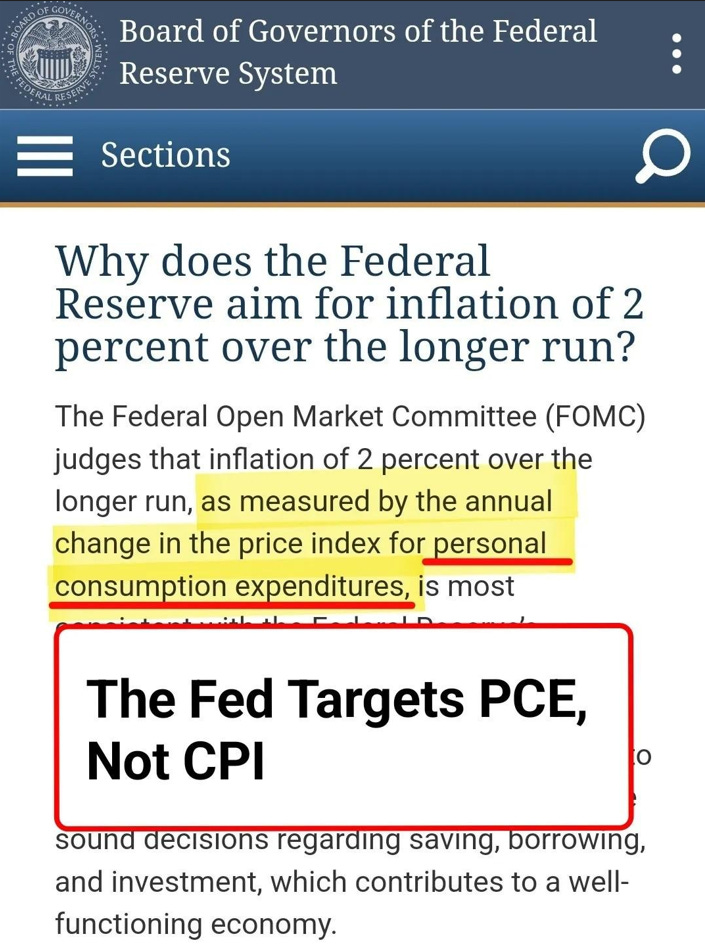
Today we received the Fed’s preferred measure of inflation called PCE and that same measure excluding food and energy called Core PCE.
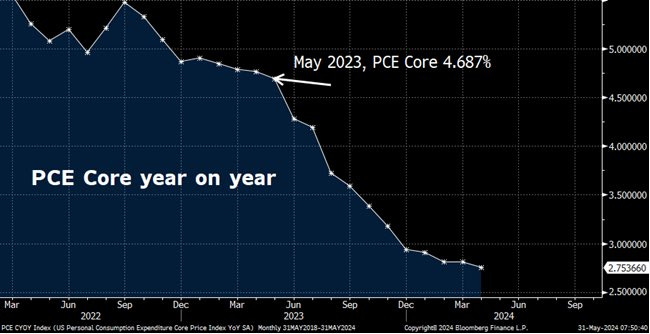
The annualized rate of the Core PCE, which came in at 2.75% today, has been lower 15-months in a row.
Here is a chart of Core PCE from Carl Quintanilla, and recall that the Fed’s ultimate target is 2.0%:
The encouraging news is that market-based core PCE (Core PCE but only focuses only on goods and services with prices set by the market), a more reliable indicator of trends, came in at 2.5% YoY.
- PCE Price Inflation YoY:
- 2.7% vs 2.7% consensus and 2.7% prior.
- PCE Price Inflation MoM:
- 0.257% vs 0.3% consensus and 0.3% prior.
- Core PCE Price Inflation YoY:
- 2.8% vs 2.8% consensus and 2.8% prior.
- Core PCE Price Inflation MoM:
- 0.249% vs 0.3% consensus and 0.3% prior.
The data was roughly in line if not slightly below estimates.
The inflationary trend that took hold in the first quarter of 2024 has now eased and we can see that with various timeframes of Core PCE shared by Jason Furman:
Core PCE annual rates:
- 1 month: 3.0%
- 3 months: 3.5%
- 6 months: 3.2%
- 12 months: 2.8%
Personal income was in line with estimates at +0.3% MoM while personal spending came in below estimates at +0.2% MoM versus estimates of +0.3%.
Here is a chart from Jason Furman:
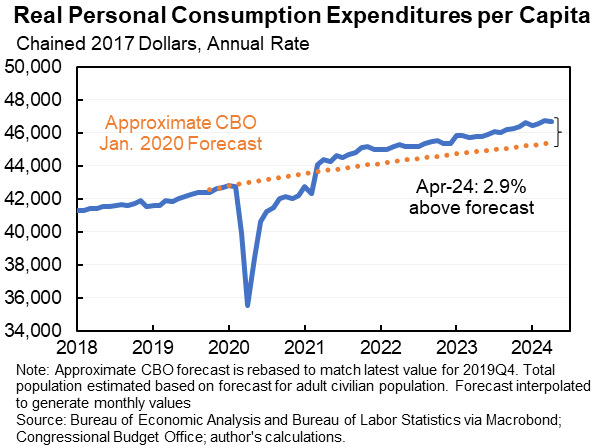
Consumption decreased in April following sharp increases in February and March, yet it still remains significantly higher than pre-COVID predictions.
Real disposable personal income per capita declined in April, and showed just a 0.5% increase YoY is now below the Congressional Budget Office’s pre-pandemic expectations for personal income growth.
Real personal spending dipped by 0.1%, and the miss on personal spending, and real disposable income all underscore the potential setup for a Federal Reserve to cut rates this Fall.
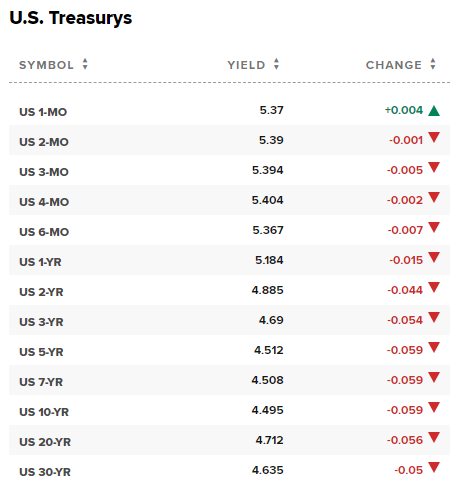
Treasury rates are down on the news in the morning trade:
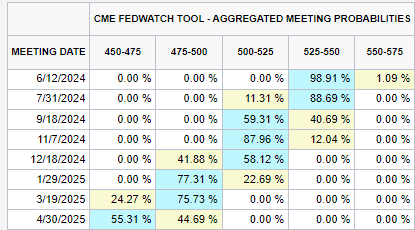
The probability of a rate cut is now nearly 60% for the September Fed meeting but just 11% for the July meeting.
Conclusion
What the Fed thinks about inflation and the underlying economic data is the only thing that matters. The economy appears to be healthy but there are signs of consumer weakening.
Inflation is back to a disinflationary trend, albeit a slow one.
Let’s just wait and let the Fed lead us, for better or worse.
This is not the time for children and amateurs – this is not the time for catastrophizing. This is the time for patience and thoughtfulness.
Consider your long-term goals and your current perspective and, perhaps, consider what i means if they are in disagreement.
Take care of yourselves and your loved ones. The irritant was COVID and the further we get from the irritant the less irritated we will be.
The Fed needs to act sooner rather than later, in our opinion.
Thanks for reading, friends.
Legal
The information contained on this site is provided for general informational purposes, as a convenience to the readers. The materials are not a substitute for obtaining professional advice from a qualified person, firm or corporation. Consult the appropriate professional advisor for more complete and current information. Capital Market Laboratories (“The Company”) does not engage in rendering any legal or professional services by placing these general informational materials on this website.
The Company specifically disclaims any liability, whether based in contract, tort, strict liability or otherwise, for any direct, indirect, incidental, consequential, or special damages arising out of or in any way connected with access to or use of the site, even if I have been advised of the possibility of such damages, including liability in connection with mistakes or omissions in, or delays in transmission of, information to or from the user, interruptions in telecommunications connections to the site or viruses.
The Company makes no representations or warranties about the accuracy or completeness of the information contained on this website. Any links provided to other server sites are offered as a matter of convenience and in no way are meant to imply that The Company endorses, sponsors, promotes or is affiliated with the owners of or participants in those sites, or endorse any information contained on those sites, unless expressly stated.
