4-10-2024
Today we received the CPI inflation report. While this is not the Fed’s preferred measure of inflation, it does inform monetary policy, as we have seen in the past.
The month over month (MoM)
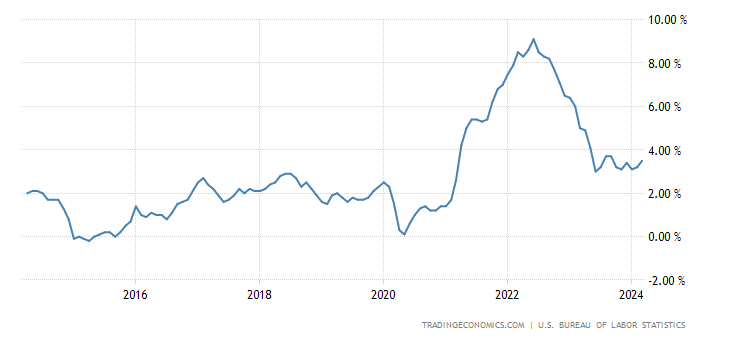
- US Inflation Rate (CPI YoY):
- 3.5% vs 3.4% consensus and 3.2% prior.
- US Inflation Rate (CPI MoM):
- 0.4% vs 0.3% consensus and 0.4% prior.
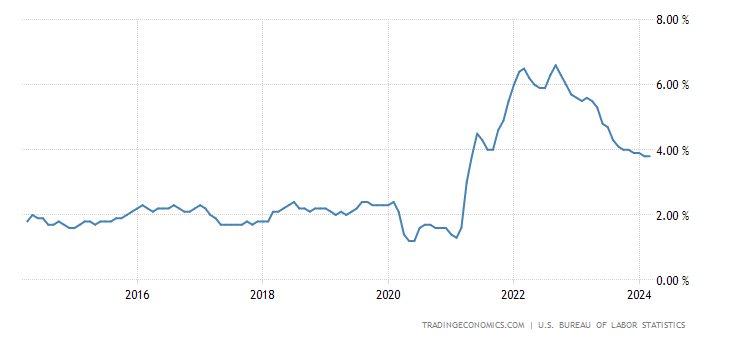
- US Core Inflation Rate (Core CPI YoY):
- 3.8% vs 3.7% consensus and 3.8% prior.
- US Core Inflation Rate (Core CPI MoM):
- 0.36% vs 0.27% consensus and 0.36% prior.
CPI and core CPI came in hotter than expected, and while I suspected a seasonal bobble in January and February numbers, this is the third month of slightly hotter CPI numbers and I don’t think seasonality is the issue entirely.
US Inflation Rate (CPI YoY) 10-Year chart (Source)
US Core Inflation Rate (Core CPI YoY) 10-Year chart (Source)
The bond market would agree. We’ll get to that in a second.
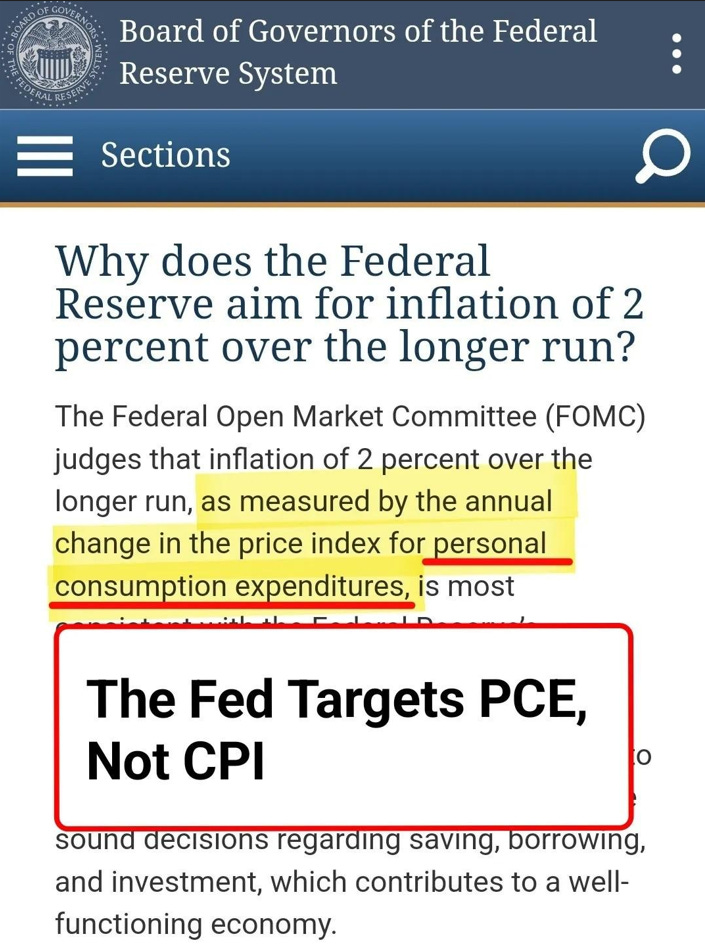
Recall that the Fed actually focuses on PCE inflation, not CPI.
Considering the significant disparity between the Consumer Price Index (CPI) and the Personal Consumption Expenditures (PCE), and considering that today’s CPI increase was driven by elements not included in the PCE, it’s essential to await the Producer Price Index (PPI) data for a clearer understanding of the potential actions by the Federal Reserve.
PPI (producer price index or “wholesaler” inflation) data comes tomorrow.
Here’s a reminder of the Fed’s focus:
Perhaps the greatest irritant to the slow CPI decline has been cost of shelter, which is a measure of rent.
That measure is driven by owner equivalent rent (OER) – the hypothetical amount homeowners would pay to rent their own homes – and rent of primary residence, which measures the rent paid by tenants for housing.
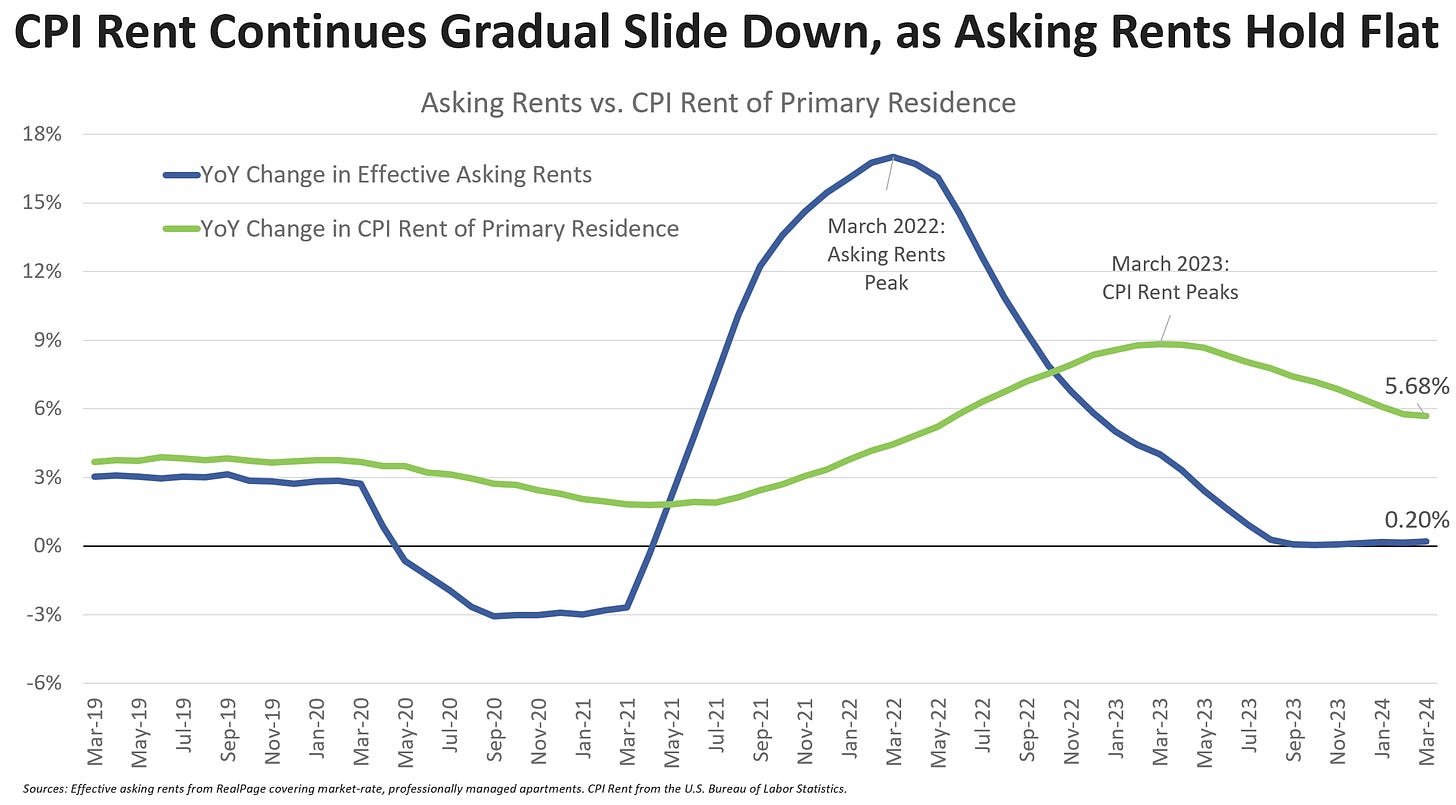
While the lag in the CPI measure is still woefully painful the “Rent of Primary Residence” component of CPI came in at 5.67% – the lowest reading since May 2022.
Cost of shelter, these two rent measures, makes up 32% of CPI and 43% of Core CPI.
Here is a fabulous chart from Jay Parsons. Note that pre-pandemic, the green line (YoY change in CPI rent of primary residence) and the blue line (YoY change in asking rents) were quite similar.
Now the difference is gigantic.
Then the pandemic hit and this lag has been irreconcilable even for the Bureau of Labor Statistics (BLS) which creates the CPI number.
At this point the lagged shelter argument has been made, everybody knows it, but nobody knows when it will end.
For clarity, CPI YoY today came in at 3.5%.
If we used number in the blue line (YoY change in effective asking rents), that would be 0.2% vs 5.68%. So, a 5.4% difference. That 5.4% difference is 32% of CPI, meaning CPI “would be” 1.8% lower or… 3.5% – 1.8% = 1.7% annual inflation.
Yes services are sticky, and yes there is something called super core, and yes. the world is ending, blah, blah, blah, but this is it. Here is the 2% target the Fed wants.
The same exercise for Core CPI would take us from 3.8% down to 1.5% Core inflation.
Another way to look at it comes from Ernie Tedeschi, former Chief Economist at the White House CEA.
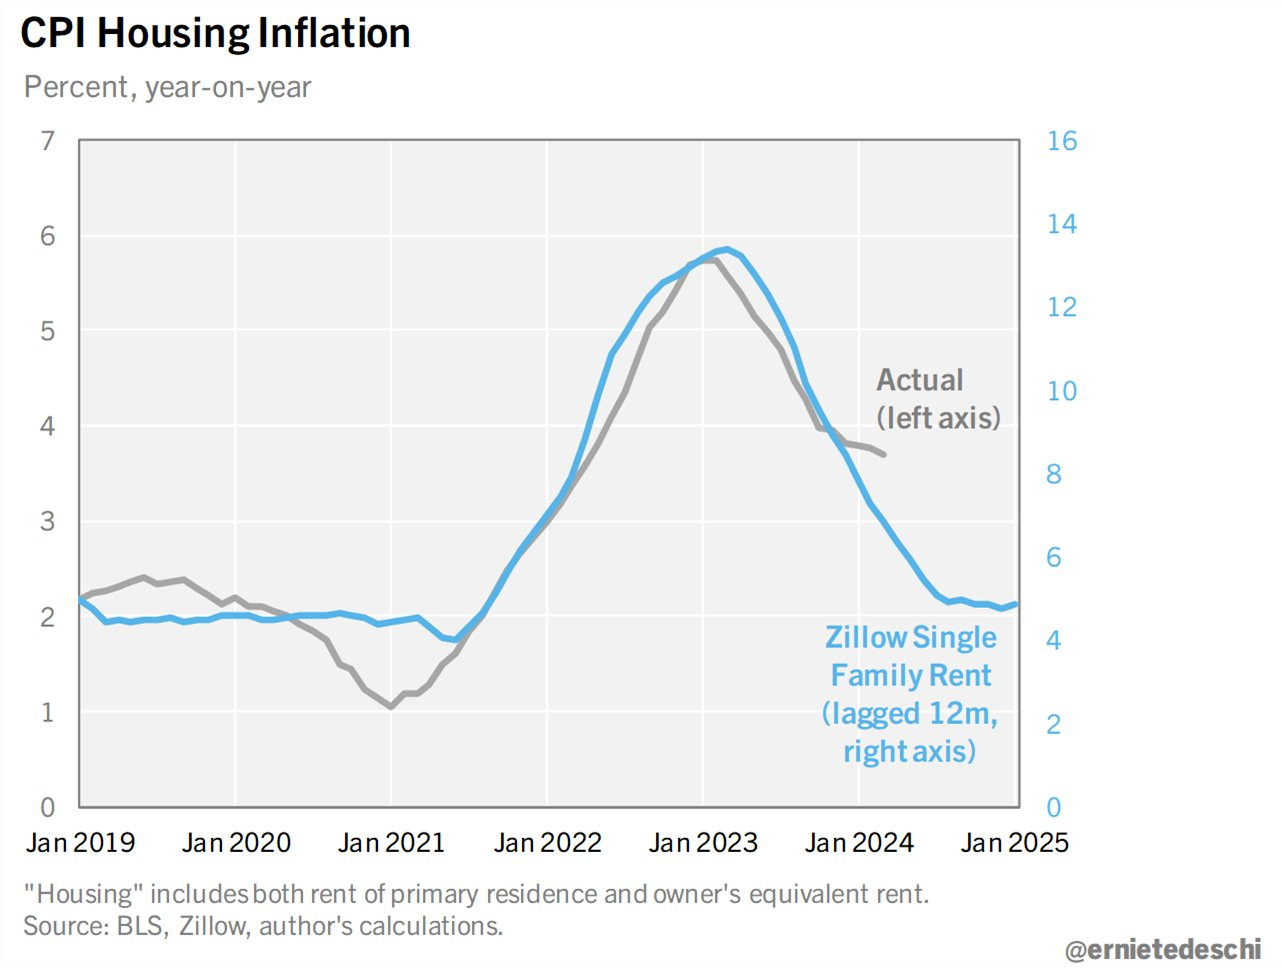
So, there is progress on the shelter cost component, it’s just really slow.
Further, In March, the deflation of core goods intensified, showing a year-over-year decrease of 0.7%, while the growth rate for core services picked up speed again, reaching +5.4%.
Core inflation now looks like this across time frames:
- 12 months: 3.5%
- 6 months: 3.2%
- 3 months: 4.6%
- 1 month: 4.6%
This is the opposite of how inflation has looked and the opposite of what progress looks like.
The treasury market collapsed on the news as rates spiked:
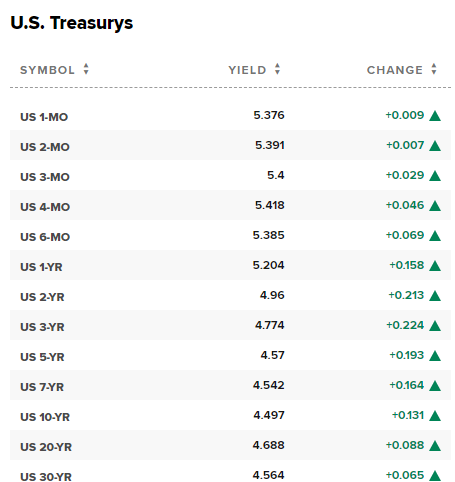
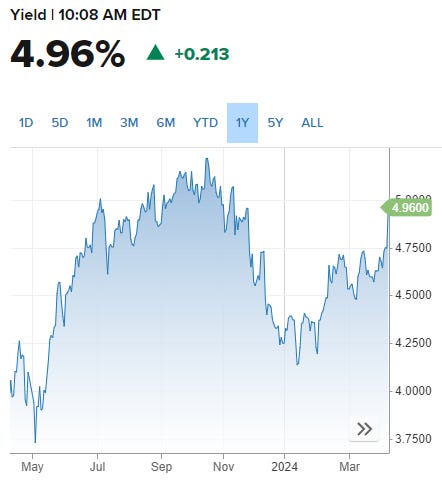
The yield on the 2-yr treasury spiked. Here’s a one-year chart – check out the intra-day move:
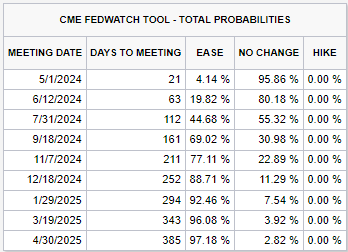
The futures market has now pushed out the first rate cut into September:
Alright, that’s it for CPI day. Tomorrow is PPI – the producer (wholesaler ) price index – parts of which feed directly into PCE.
That’s it for today!
