Lede
Today we take the option strategy approach we applied to the indices over to the “magnificent seven.”
Conditions
Last time we wrote this:
Option Trading SPX and IWM: Set-ups in the Indices
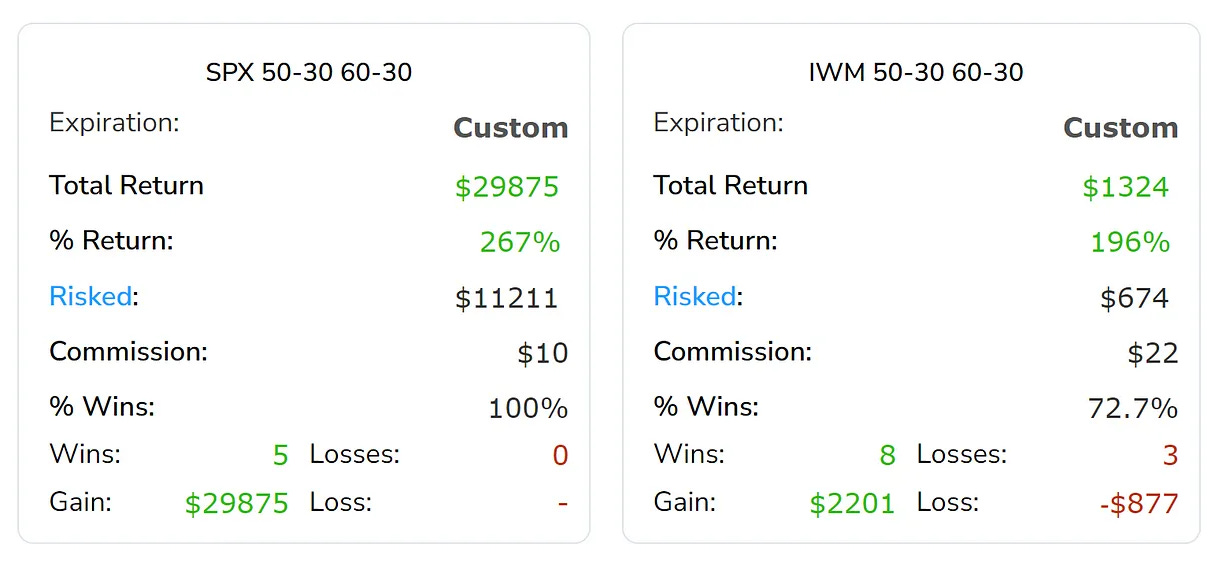
Lede Today we extend our analysis from the prior post, and look at various option trades in the S&P 500 and the Russell 2000. This is a reminder that while there is plenty of room for stock specific backtests, pre-earnings, post-earnings, ignoring earnings, and everything in between, there are also opportunities to examine in the indices.
Today we take that same multi-legged strategy and backtest it with AAPL, AMZN, GOOGL, META, MSFT, NVDA, and TSLA.
The set-up, or the open rules ae the following:
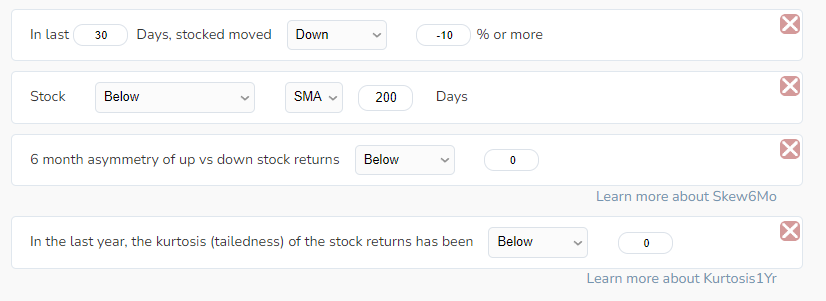
Let’s break it down, one at a time.
We note that the third and fourth requirements are explained in great depth in the video here: A Remarkable Finding in Finance.
- The first requirement is that the stock is down at least 10% in the last 30-days.

- The second requirement is that the stock is below the 20—day simple moving average.

- The third requirement is that that in the prior 6-months, the stock’s return distribution has net negative skew. This means that stock returns have experienced an asymmetry to the downside relative to the upside using our proprietary method of computation.

- The fourth requirement is that in the prior 12-months, the net kurtosis, which is the fatness of the upside tail compared to the fatness of the downside tail is negative. That means that in the last year, “large moves” or “tail moves” have been more frequent to the downside than the upside using our proprietary method of computation.
In total, when these four requirements all occur, we find a stock down more than 10%, in technical failure, and having experienced substantially negative day to day return distribution characteristics.
In a single line, it would read:
“S*** is pretty bad.”
It’s nearly impossible to track all these things coinciding, which is why we simply set Alerts in TradeMachine so we get emailed and text messaged when this occurs for any of these stocks.
Alright, “s*** is pretty bad,” but now what?
The Strategy
Sure, we could definitely look at straight down the middle bullish speculations once these conditions occur, but given how badly the stock has been doing once this triggers, we were less interested in a bullish speculation, and more interested in a “not very bearish” speculation.
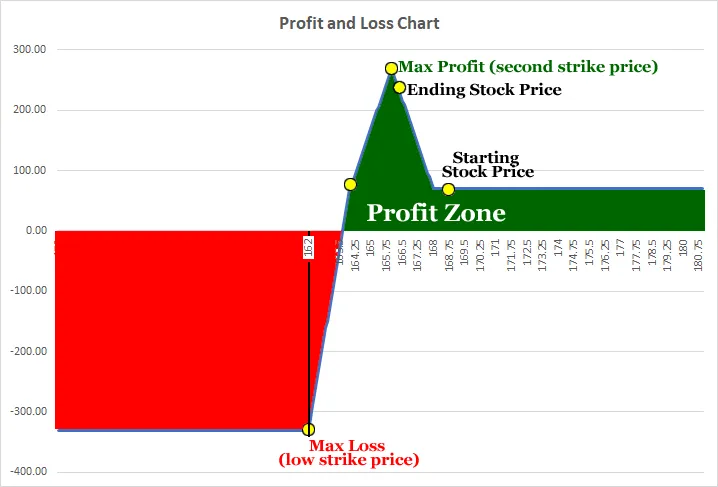
Before we reprise the strategy, a PnL picture at expiration could help.
Note that if the stock goes up any amount or stays where it is, the strategy wins.
If the stock goes down a little the strategy in fact hits maximum gain, but then, yes, if there is another real tumble beyond the recent past, the strategy will be a loser, though it is capped.
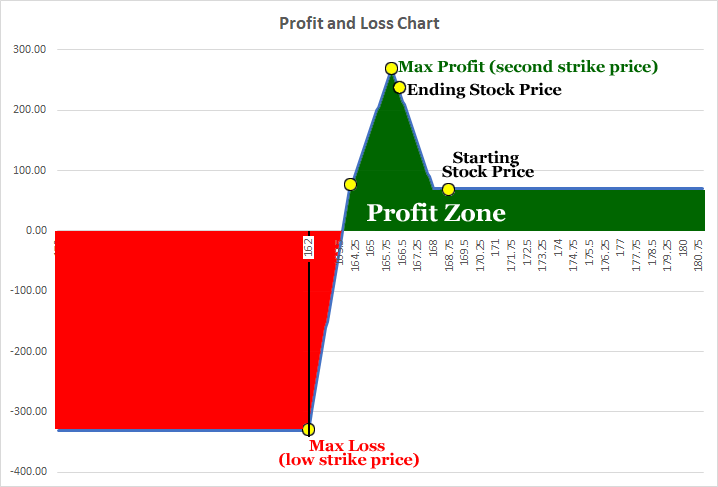
So, this is a “not very bearish” speculation.
And now the strategy itself:
The strategy we tested is called “1-by-2 by 1-by-2.”
It looks like this:

Don’t let your eyes rollback and ignore this.
These are the results we’re after (3-year backtest):

Yes, a one-month trade that has an average return of 20% with 15 wins and 0 losses over three years.
Now, let’s review each leg.
Rules
The first leg of this trade is simply a long, out of the money (37 delta) put. That’s it.
* Buy a 37 delta monthly put.

The second leg of this trade sells two further out of the money (30 delta) puts.
* Sell two 30 delta monthly puts.

The third leg of this trade sells an even further out of the money (25 delta) put.
* Sell a 25 delta monthly put.

The fourth and final leg of this trade purchases two even yet further out of the money (10 delta) puts, leaving the entire strategy long 3 options and short 3 options — the risk is well defined.
* Buy two 10 delta monthly puts.

What Does This Mean?
This is casually called a ratio spread, and specifically this is a 1 x 2 x 1 x 2 (read out loud as “1 by 2 by 1 by 2”) put spread.
In English
This strategy does well in a bull market but does best in a slightly bearish market. It does worst when there is a large stock drop, but that loss is capped.
Now, here are the results over the last five-, three-, and one-years.
5-years
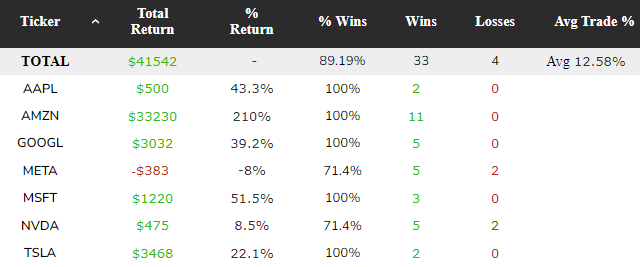
3-years

One-year

That’s it.
On average this set-up generated about six trades a year – a great addition to a portfolio of alerts.
Conclusion
There’s a difference between wanting something and liking the idea of something.
The difference is that one is for day dreams and the other is effort.
Legal
The information contained on this site is provided for general informational purposes, as a convenience to the readers. The materials are not a substitute for obtaining professional advice from a qualified person, firm or corporation. Consult the appropriate professional advisor for more complete and current information. Capital Market Laboratories (“The Company”) does not engage in rendering any legal or professional services by placing these general informational materials on this website.
The Company specifically disclaims any liability, whether based in contract, tort, strict liability or otherwise, for any direct, indirect, incidental, consequential, or special damages arising out of or in any way connected with access to or use of the site, even if I have been advised of the possibility of such damages, including liability in connection with mistakes or omissions in, or delays in transmission of, information to or from the user, interruptions in telecommunications connections to the site or viruses.
The Company makes no representations or warranties about the accuracy or completeness of the information contained on this website. Any links provided to other server sites are offered as a matter of convenience and in no way are meant to imply that The Company endorses, sponsors, promotes or is affiliated with the owners of or participants in those sites, or endorse any information contained on those sites, unless expressly stated.
